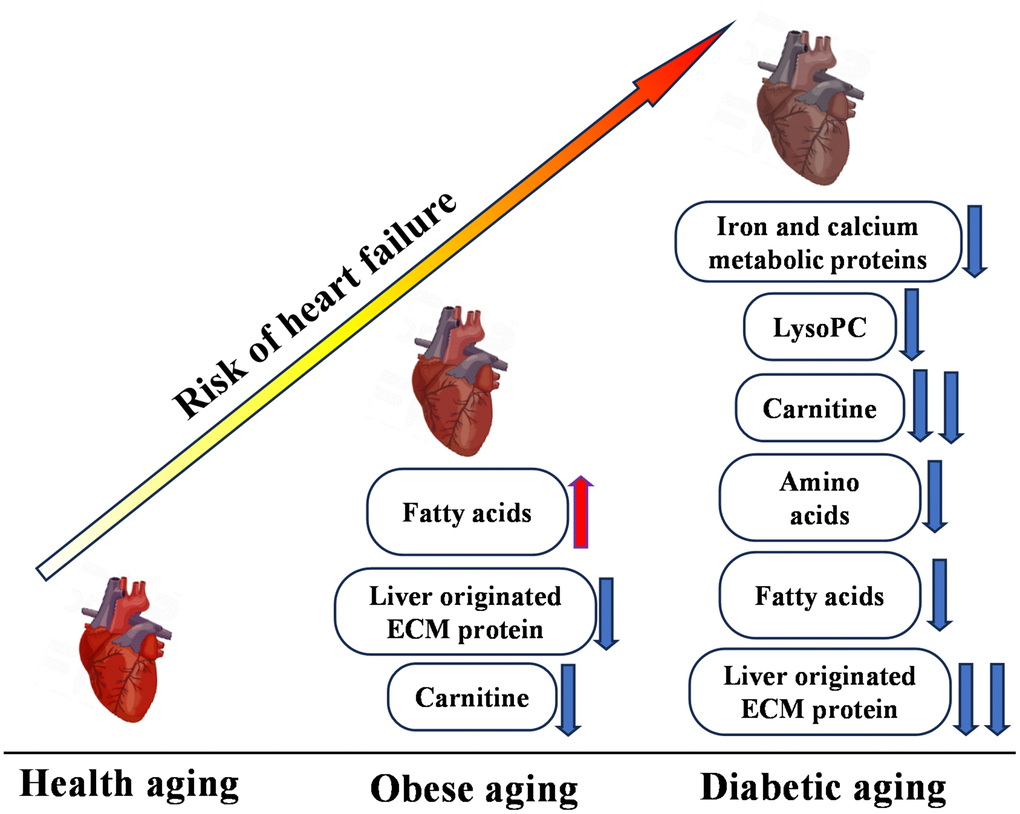
Figure 6.Multi-omics overview highlighting differences between control (CON), obesity (OB), and type 2 diabetes (TM) groups. This figure presents a comprehensive summary of the multi-omics changes observed across proteomic, metabolomic, and lipidomic profiles comparing the CON, OB, and TM groups.