Submit an Article
Navigate
Home
Editorial Board
Editorial Policies
Current Volume
Archive
Scientific Integrity
Publication Ethics Statements
Interviews with Outstanding Authors
Newsroom
Sponsored Conferences
Podcast
Contact
Special Collections
Submit an Article
Online ISSN: 1945-4589
Research Paper
|
Volume 17, Issue 6
|
pp. 1405–1428
DoliClock: a lipid-based aging clock reveals accelerated aging in neurological disorders
Back to article
Figure 2
(2 of 3)
−
100%
+
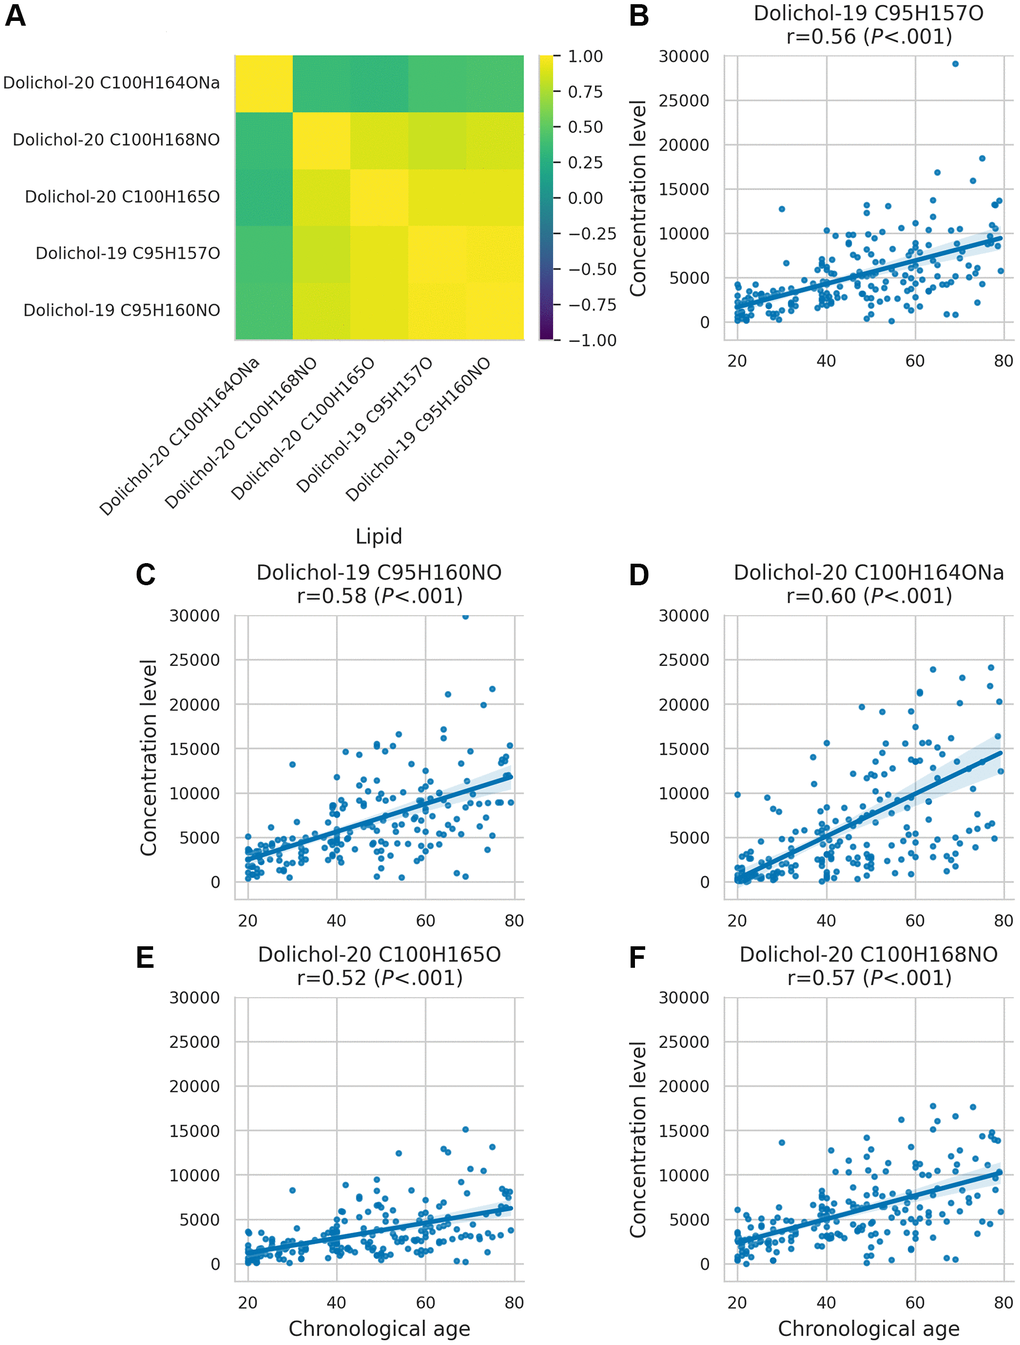
Figure 2.
Dolichol correlation matrix and age-related concentration changes.
(
A
) Correlation matrix illustrating the relationships between different dolichol subspecies. (
B
–
F
) Scatter plots showing the behaviour of dolichol subspecies across age.