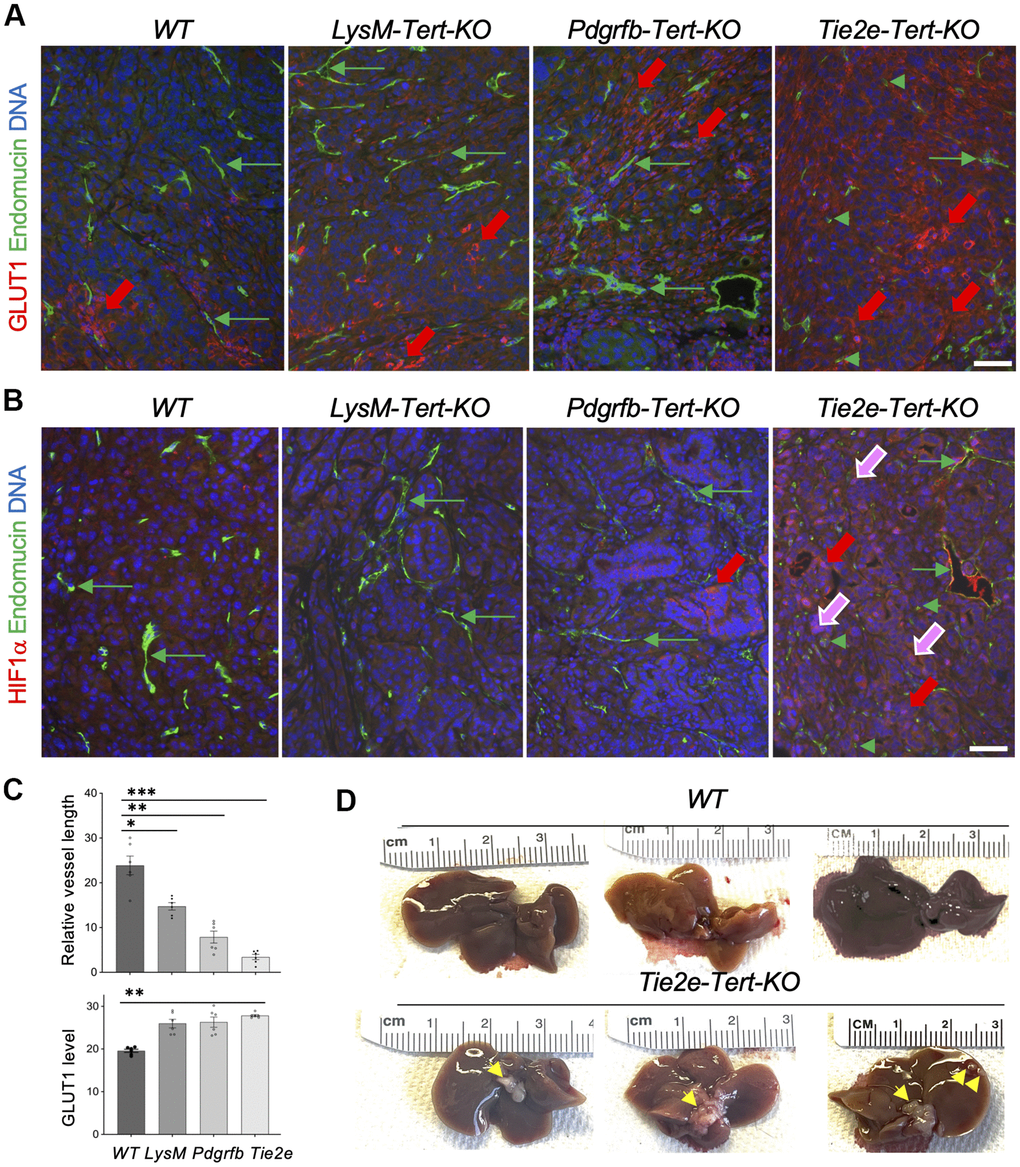
Figure 4.Tert KO in EC promotes pancreatic cancer metastasis linked with vasculature dysfunction and hypoxia. (A) Paraffin sections of representative KPC tumors from EC-Tert-KO and WT littermates subjected to IF showing GLUT1 expression in cancer cells (red arrows) and endomucin+ endothelium (GFP). (B) Paraffin sections of representative KPC tumors from indicated Tert-KO and WT littermates subjected to IF showing HIF1α expression in cancer cells (red arrows) and nuclear localization (purple arrows). Endomucin+ IF reveals blood vessels (green arrows) and isolated EC (green arrowheads). (C) Quantification of mean blood vessel length (A, B) and GLUT1 IF (A). Shown are mean +/- SEM, *P<0.001, **P<0.0005, ***P<0.0001, ANOVA with a post-hoc test. (D) Representative livers from EC-Tert-KO and WT littermates with pancreatic KPC tumors with liver metastases indicated (arrows). DNA is blue. Scale bar: 100 μm.