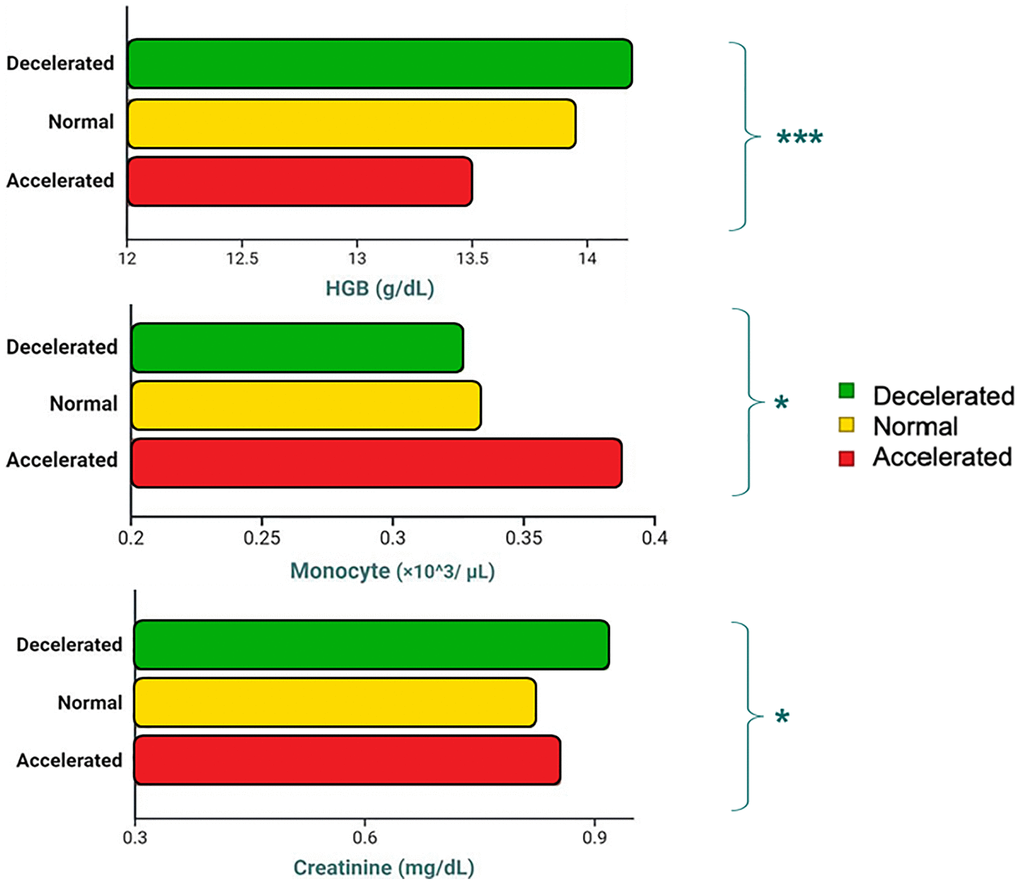
Figure 4.Differences in exemplificative blood-based markers depending on Muscle Age Acceleration (MAA) status (Decelerated vs. Normal vs. Accelerated).
Figure 4 — Developing a quantitative estimate of muscle age acceleration by a novel phenotypic clock: cross-sectional study in healthy, middle-aged and older adults | Aging