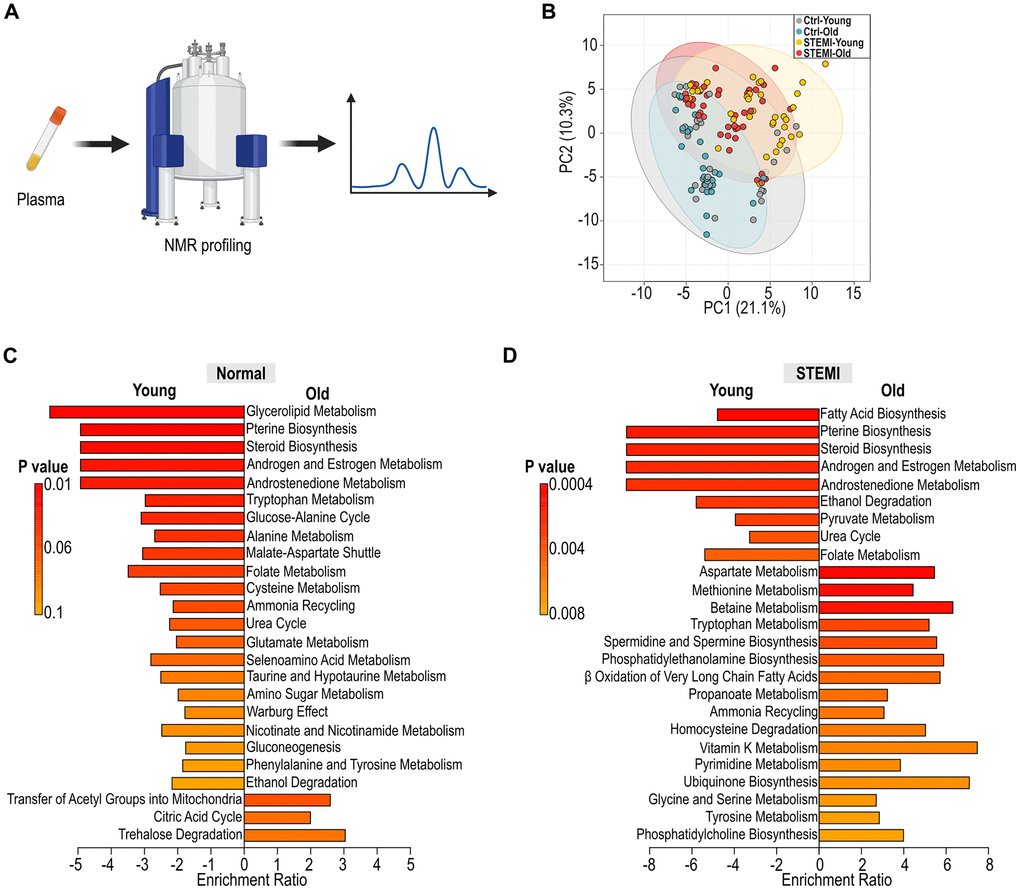
Figure 6.Alteration in human plasma metabolic profiling across age groups. (A) Schematic illustration of human plasma profiling using NMR. (B) PCoA displaying the variation in normal and STEMI human plasma metabolites across different age groups. (C) Identification of differential metabolic pathways in young and aged control plasma. (D) Analysis of differential metabolic pathways in young and aged STEMI plasma.