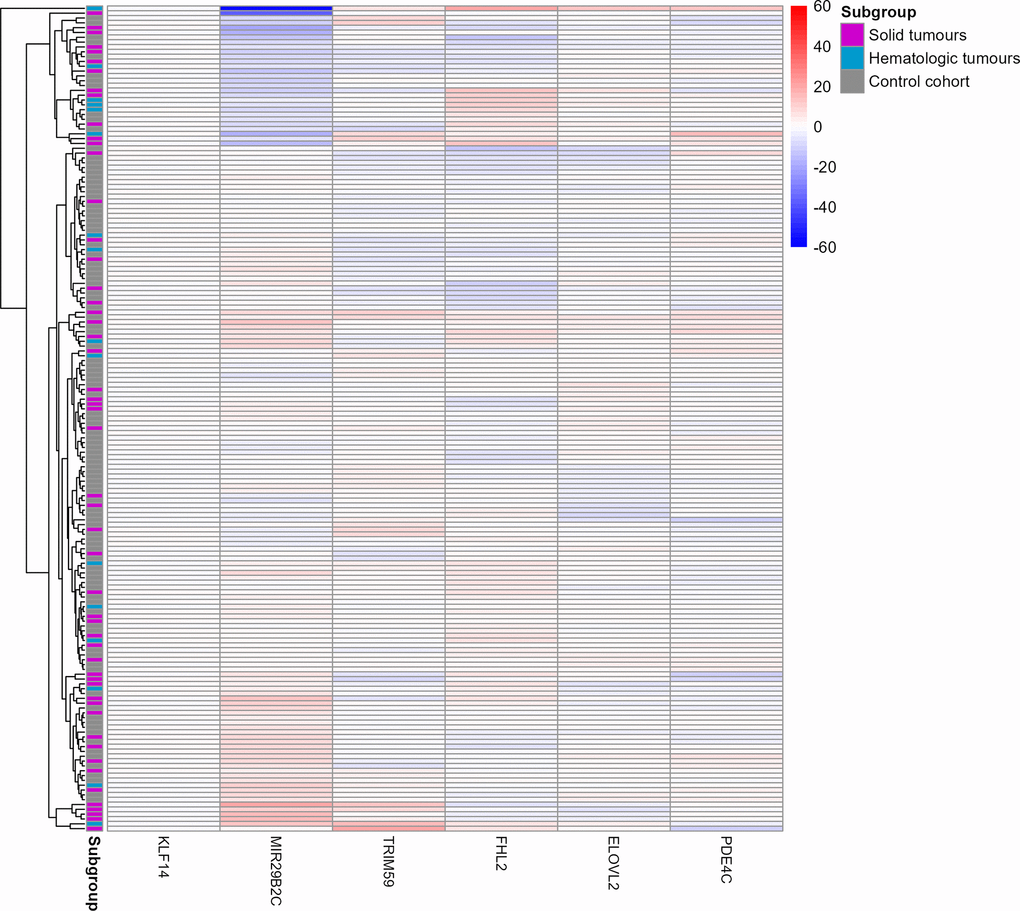
Figure 3.Heat map of the six target CpG sites used in the age estimation tool in the u75 cohort and controls. Methylation beta values are adjusted for chronological age. The labels on the x-axis refer to the respective target CpG site in each marker. The two cancer patients Cancer033 and Cancer042 in the two top rows showed a differential methylation in the MIR29B2C target CpG site. Red colouring indicates higher beta values and blue colouring indicates lower beta values. Rows indicating samples from the three subgroups are indicated in grey (control cohort), blue (solid tumours) or magenta (hematologic tumours).