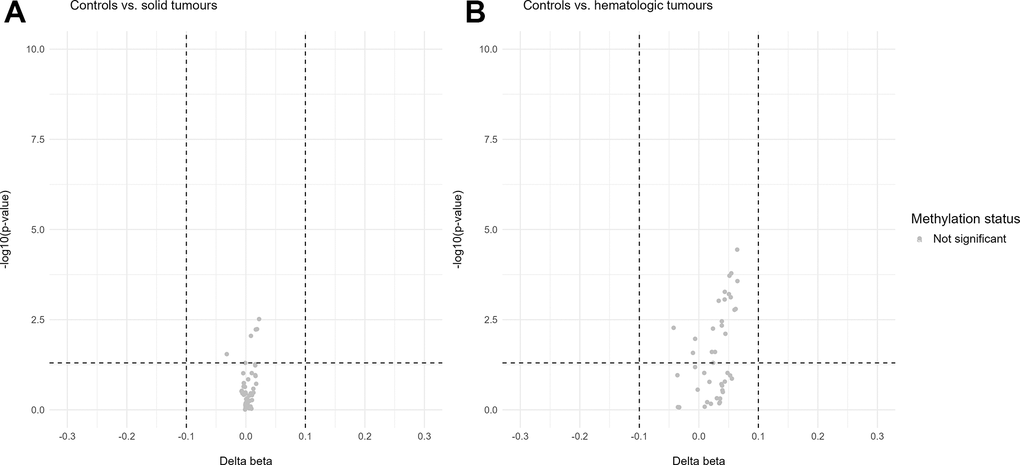
Figure 5.Volcano plots of differentially methylated sites in the u75 cohort. Hypomethylation is defined as delta beta values below -0.1 and p-values below 0.05 and hypermethylation as delta beta values above 0.1 and p-values below 0.05. (A) shows no differentially methylated sites between the control cohort and the solid tumours. (B) shows no differentially methylated sites between the control cohort and the hematologic tumours.