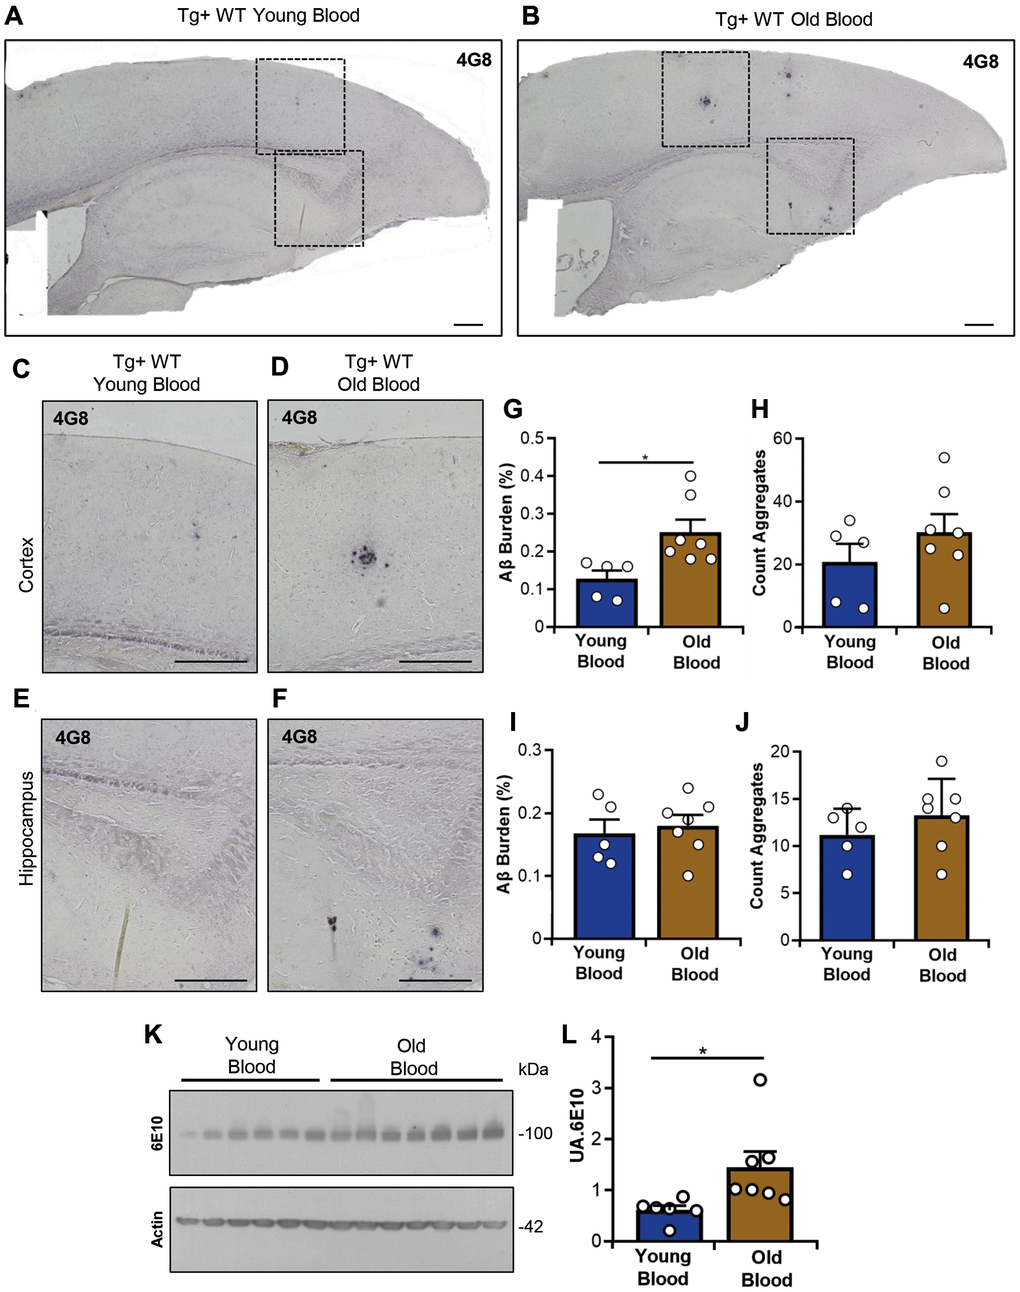
Figure 3.Evaluation of Aβ deposition and APP levels in Tg2576 mice treated with blood from old and young wild type mice. Representative images of Aβ accumulation in the cortex and hippocampus (A, B). Higher magnification images of the cerebral cortex (C, D) and hippocampus (E, F) are also shown. Tissue slices were probed with the 4G8 antibody as described in the Materials and Methods. Scale bars: 1,000 μm (A, B), 500 μm (C–F). Quantitative analyses of Aβ burden and plaque number in the cerebral cortex (G, H) and hippocampus (I, J) are displayed. (K) Representative western blot image showing APP levels in brain homogenates from blood-treated mice (upper panel), with actin used as a loading control (lower panel). (L) Densitometric quantification of APP levels shown in (K), expressed in arbitrary units (UA). Data include 5–7 animals per group, (random mix of males and females; young donor group: 1–3M/2–3F; old donor group: 1–3M/2–4F). Sex was not included as a variable in statistical analyses. Data values are expressed as mean ± SEM. Molecular weight markers (KDa) are indicated. Each lane represents one individual animal. Statistical analyses: Mann–Whitney U-test for panels (G) and (L); Student’s t-test for panels (H), (I), and (J). *p < 0.05, **p < 0.01.