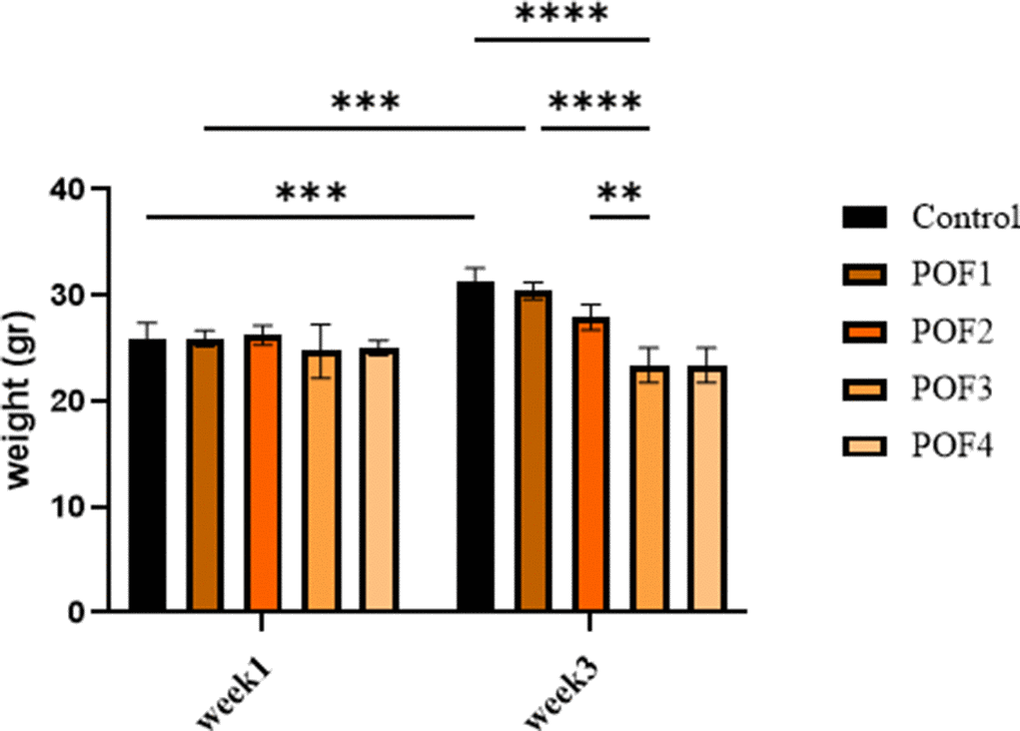
Figure 2.Body weight of mice at week 1 (first day post-administration) and week 3 (the twenty-first day post-administration) across different treatment groups: Cyclophosphamide (CTX:80,100,120,120 mg/Kg). Data are presented as mean ± SD. Two-way ANOVA revealed significant effects of time, group, and time × group interaction. Post-hoc analysis indicated significantly lower body weights in POF2, POF3, and POF4 groups compared with controls at week 3 (p < 0.05).