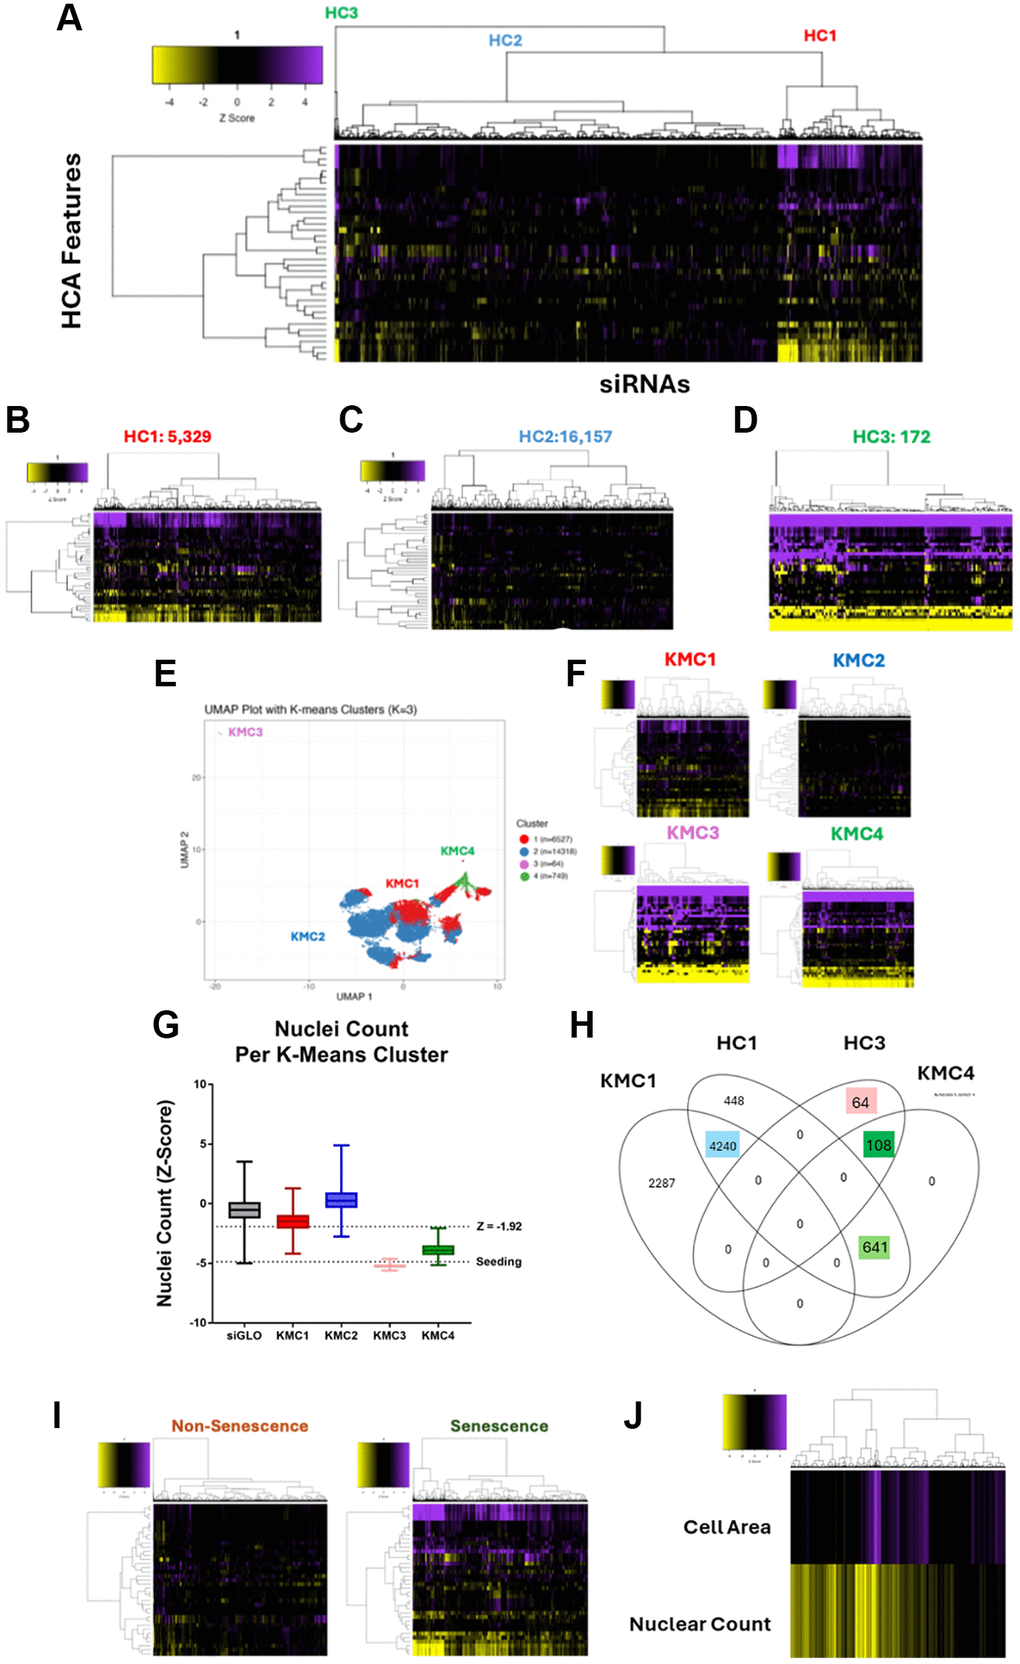
Figure 1.Genome-wide siRNA HeLa screen and cluster-based senescence labelling. (A) Heatmap representing high content analysis feature (HCA; y-axis) profiles of a genome-wide siRNA screen. Treatments (siRNAs; x-axis) were grouped into three through hierarchical clustering. (B–D) Heatmap of individual hierarchical clusters. (E) UMAP plot showing 36 feature profiles of every treatment within the screen, labelled with K-means clustering groups. (F) Heatmap profiles of K-means clusters. (G) Nuclei counts for treatments in each K-means cluster. (H) Venn diagram showing overlap between hierarchical and k-means clustering. (I) Heatmap profiles of treatments labelled as either Non-Senescence or Senescence. (J) Heatmap profile showing cell area and nuclear count Z-Scores of all senescence conditions. In all heatmaps, purple indicates positive modulation and yellow negative modulation of greater than 1.96 Z-scores from siGLO control. Black indicates a Z-score between –1.96 and 1.96.