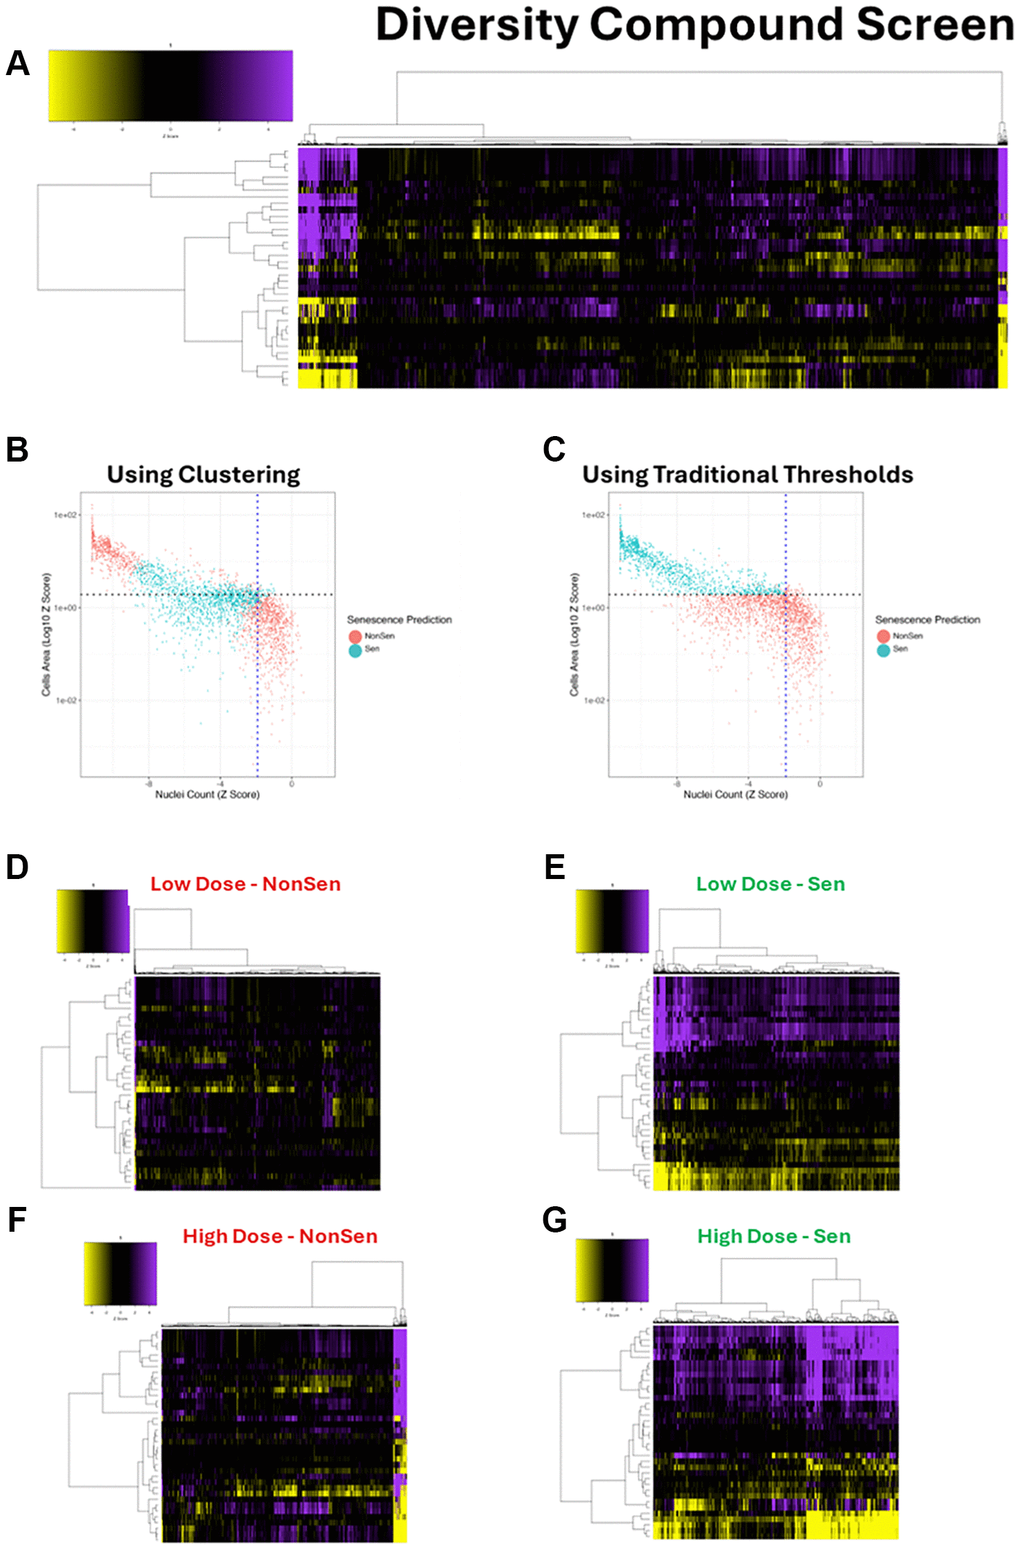
Figure 4.Diversity library compound screen. (A) Heatmap representing high content analysis feature (HCA; y-axis) profiles of a compound diversity library screen (Compounds; x-axis) performed in MB-468 cells. (B, C) Scatter plots showing Z-scores of nuclear count and cell area (log10) for all compound treatments. Points are coloured Non-Senescent (red) or Senescent (blue) according to SAMP-Score classification based on models constructed with either cluster based or traditional threshold-based data labelling. (D–G) Heatmap profiles for treatments classified as either Non-Senescent (NonSen) or Senescent (Sen) by SAMP-Score at both low (10 μM) and high screening doses (50 μM). In all heatmaps, purple indicates positive modulation and yellow negative modulation of greater than 1.96 Z-scores from DMSO vehicle control. Black indicates no change.