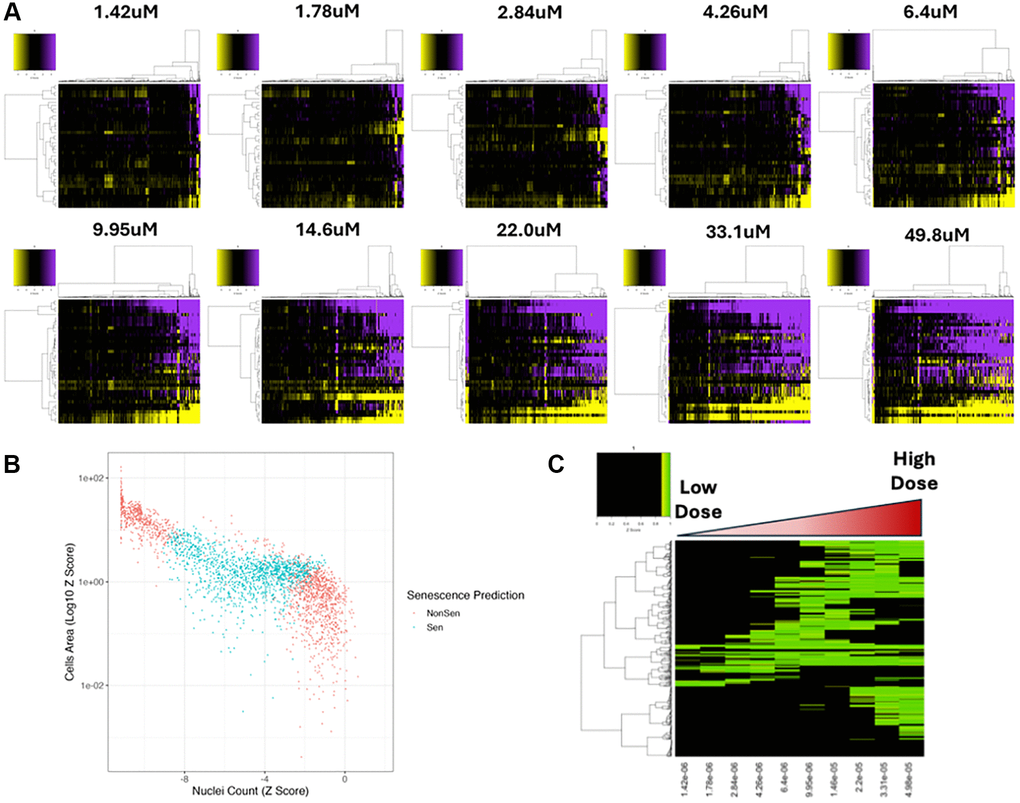
Figure 5.Dose response compound screen. (A) Heatmap representing high content analysis feature (HCA; y-axis) profiles of a dose response compound screen (Compounds; x-axis) performed in MB-468 cells. In all heatmaps, purple indicates positive modulation and yellow negative modulation of greater than 1.96 Z-scores from DMSO vehicle control. Black indicates no change. (B) Scatter plot showing Z-scores of nuclear count and cell area (log10) for all compound treatments. Points are coloured Non-Senescent (red) or Senescent (blue) according to SAMP-Score classification. (C) Heatmap showing SAMP-Score prediction co-efficient for all compounds (y-axis) and doses (x-axis). Black indicates score of <0.9 which is scored as non-senescence.