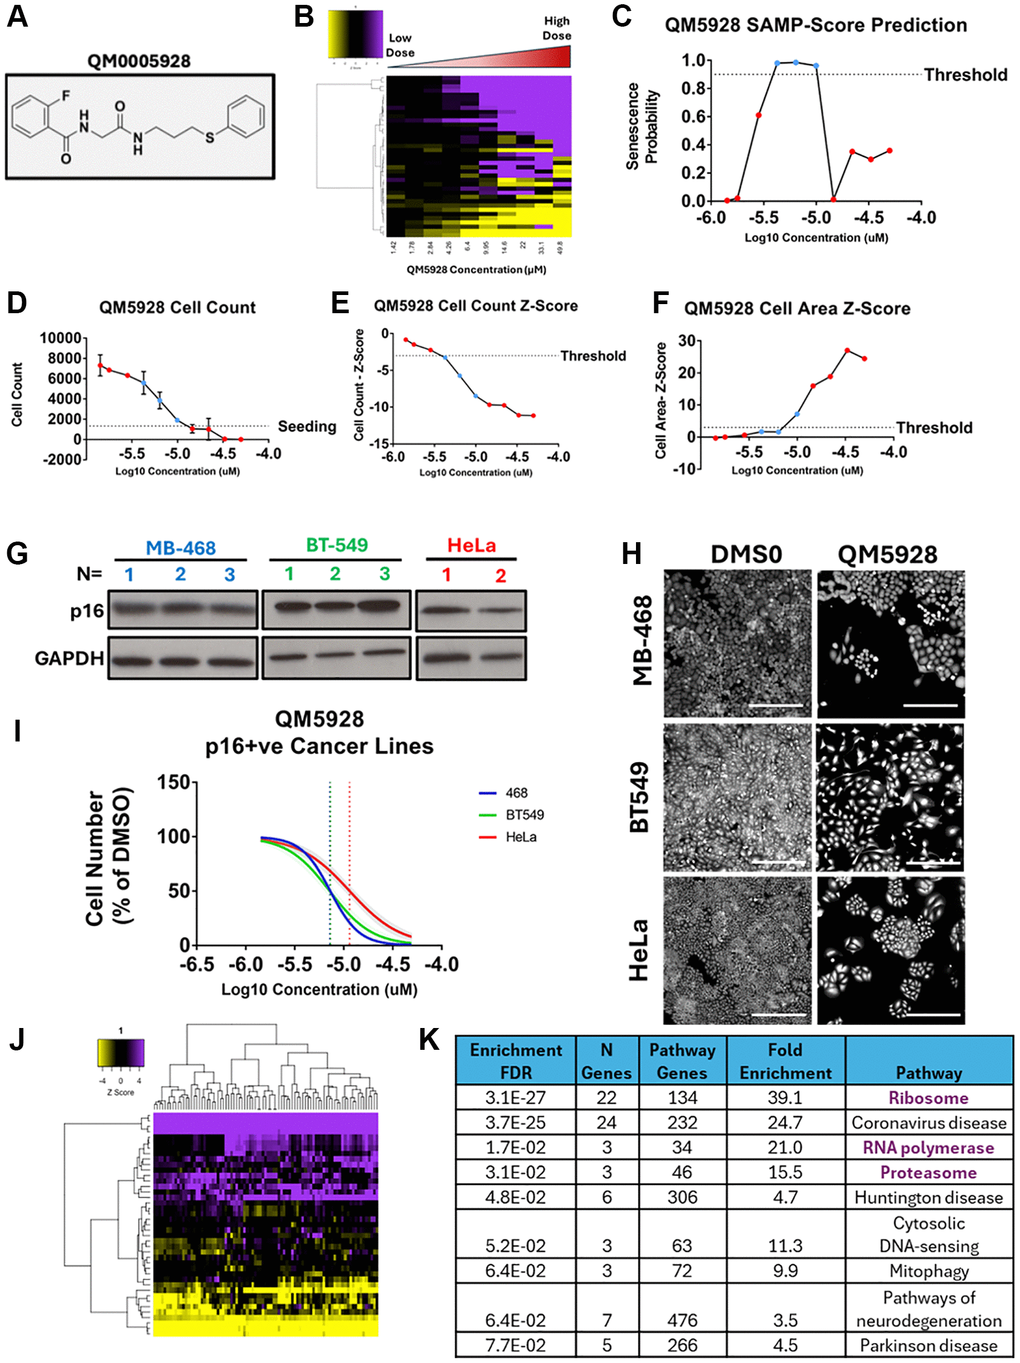
Figure 6.Validation of QM0005928 (QM5928). (A) QM0005928 chemical structure. (B) Heatmap representing high content analysis feature (HCA; y-axis) profiles of a dose response of QM5928 (x-axis). (C) Line plot showing change in SAMP score with increasing doses of QM5928. (D) Raw cell counts of increasing doses of QM5928 (Red = NonSen and Blue = Sen SAMP-Score Classification). (E, F) Z-scores for cell count and cell area increasing doses of QM5928. (Red = NonSen and Blue = Sen SAMP-Score Classification). (G) Western plot showing p16 expression in MB-468, BT549 and HeLa Sen-Mark+ cancer lines. (H, I) Cell counts for MB-468, BT549 and HeLa Sen-Mark+ cancer lines in response to QM5928. N = 3. Scale bar = 100 μm. (J) Heatmap representing high content analysis feature (HCA; y-axis) profiles of HeLa screen treatments that phenocopy QM5928 by hierarchical clustering. (K) KEGG pathways analysis of HeLa screen treatments that phenocopy QM5928 by hierarchical clustering. The data for MB-468s in Figures 6 and 7 are derived from the same experimental dataset, presented in different formats to emphasise distinct aspects of the findings.