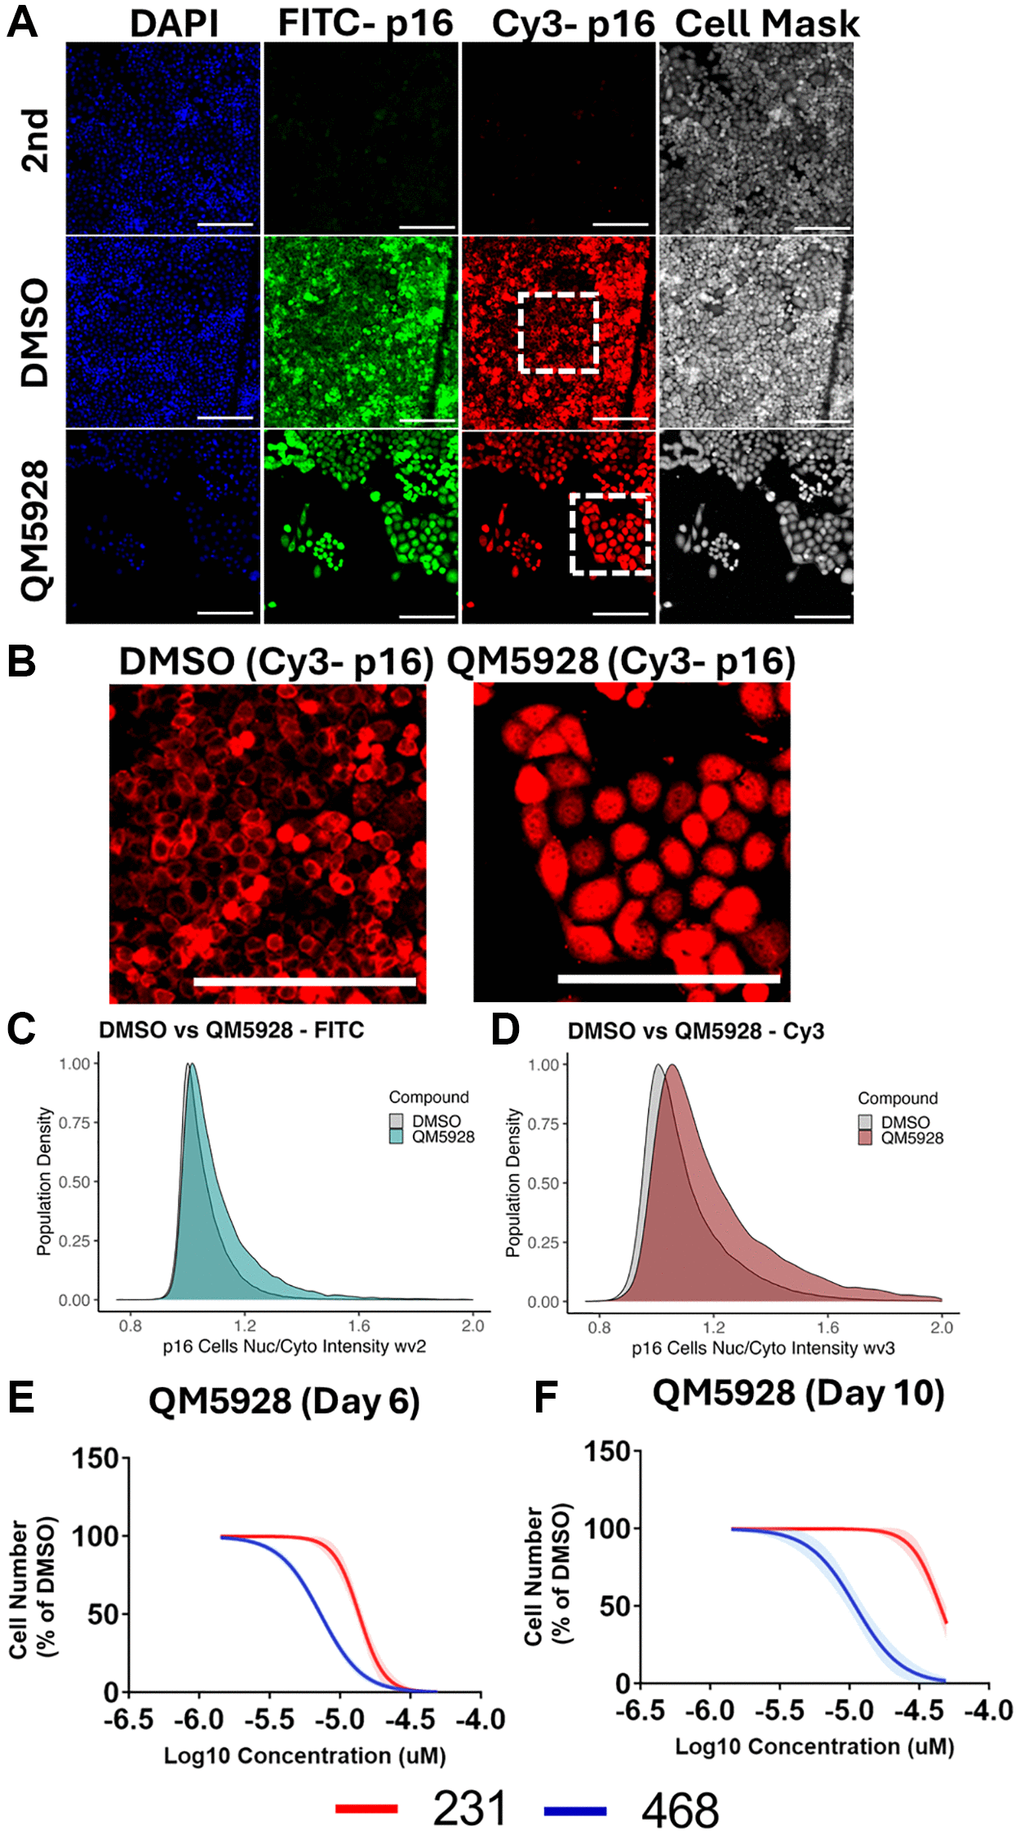
Figure 7.Interplay between p16 localisation and QM5928. (A) Immunofluorescence staining of MB-468s treated with either DMSO or QM5928 for DAPI, p16 (Santa Cruz - FITC), p16 (Protein Tech - Cy3) and Cell Mask. Secondary only controls (2nd) did not receive primary p16 antibodies. (B) Digital zoom of white boxed areas in A, for p16 (Protein Tech - Cy3). Scale bars = 100 μm. (C, D) Scaled probability density estimate quantitation of nuclear/cytoplasmic intensity ratios for MB-468s stained with p16 in the FITC and Cy3 channels. A higher value indicates increased nuclear staining. Area under the curve is equal to 100% of the population. N = 3. (E, F) Cell counts for MB-468 (p16 positive - blue) and MB-231 (p16-null - red) cancer lines in response to QM5928 at day 6 or day 10. N = 3. The data for MB-468s in Figures 6 and 7 are derived from the same experimental dataset, presented in different formats to emphasise distinct aspects of the findings.