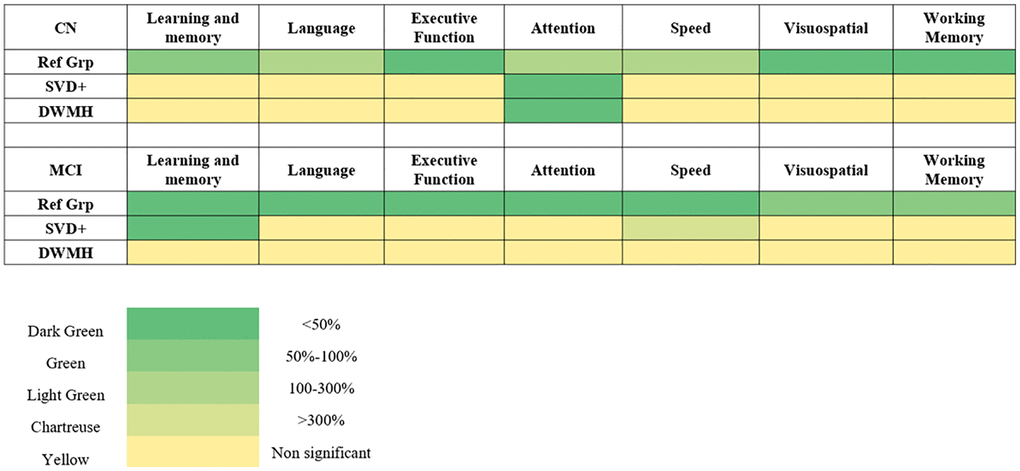
Figure 1.A heatmap illustrating the relative impairment of various cognitive domains across different participant groups, including cognitively normal (CN) and mild cognitive impairment (MCI). Comparisons are made across the general phenotype (Ref Grp), participants with white matter hyperintensities (WMH; SVD+ participants), and deep white matter hyperintensities (DWMH). The heatmap uses five distinct colours to depict the severity of impairment in each domain. Dark green represents the domain with the greatest impairment (i.e., the most affected domain in each group), while progressively lighter shades indicate less impairment relative to this maximum. Specifically, green indicates 50–100% of the maximal impairment, light green corresponds to 100–300%, chartreuse represents >300%, and yellow indicates non-significant differences.: dark green represents the domain with the greatest impairment, including any domain showing less than 50% of this impairment relative to the most affected domain. Green indicates impairments between 50–100%, light green corresponds to impairments from 100–300%, and chartreuse represents impairments exceeding 300%. Yellow represents domains that are non-significant. Abbreviations: CN: cognitively normal; MCI: mild cognitive impairment; WMH: white matter hyperintensities; SVD: small vessel disease.