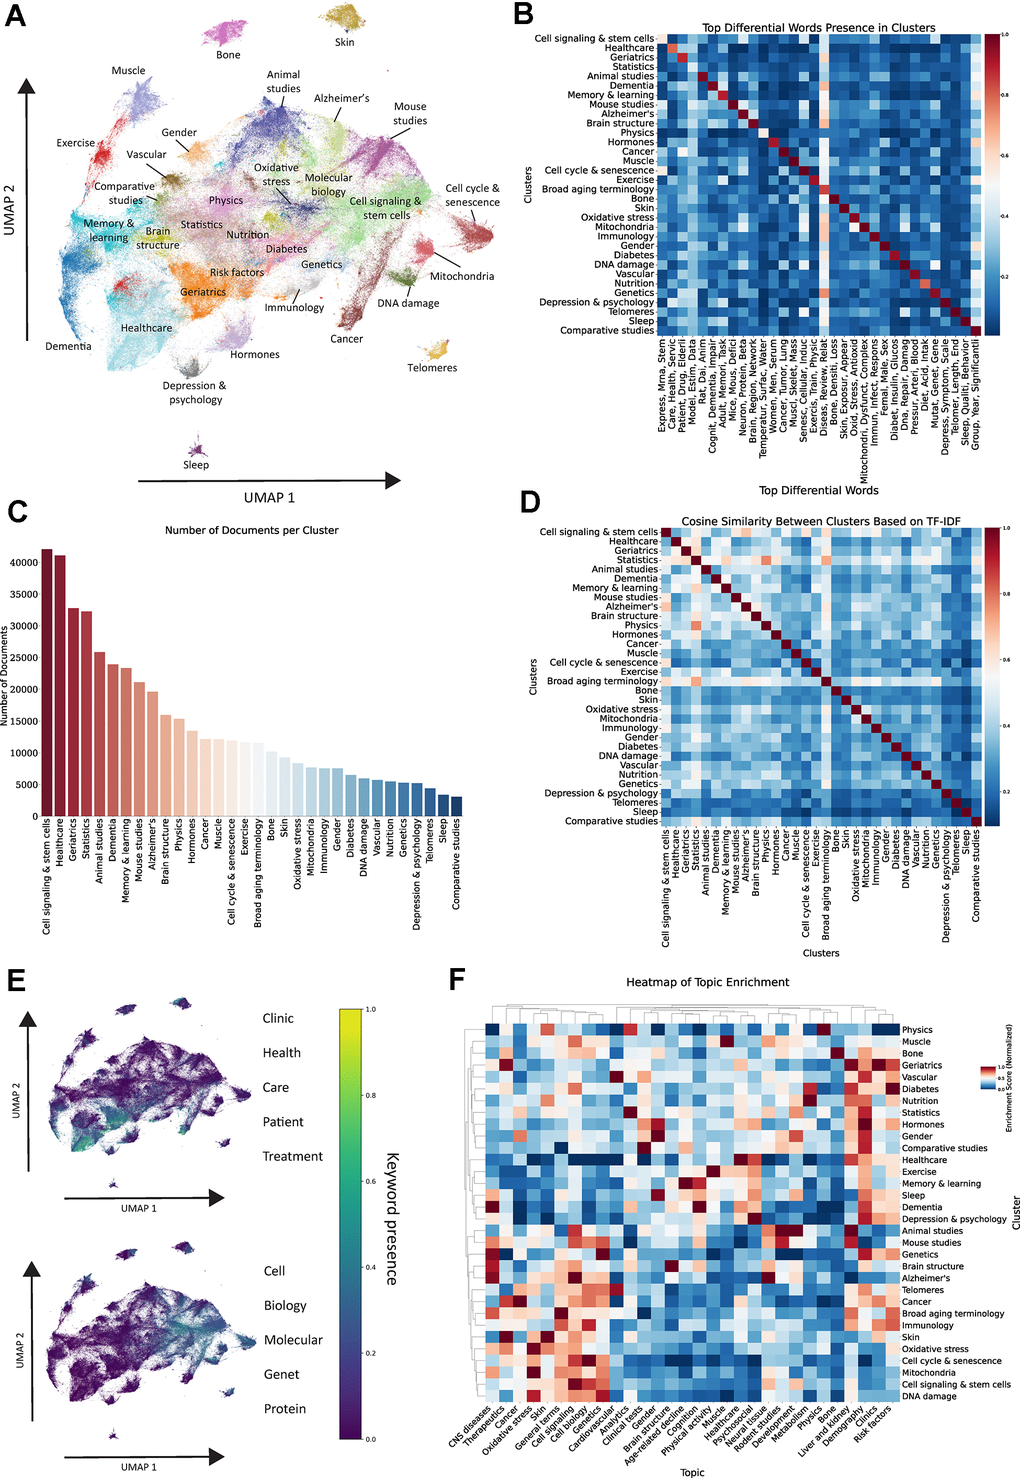
Figure 2.Unsupervised clustering of aging related abstracts. (A) UMAP and Leiden clustering of vectorized documents in the dataset. (B) Heatmap showcasing top differential words in each cluster, color reflects the proportion of documents within each cluster containing any stem from the respective word group. (C) Number of documents per cluster. (D) Cosine similarity analysis between clusters based on TF-IDF vectors. (E) UMAP representation highlighting the presence of keywords related to clinics and healthcare vs. molecular and cell biology. (F) Hierarchical clustering heatmap of topic enrichment in each cluster, color reflects normalized enrichment score.