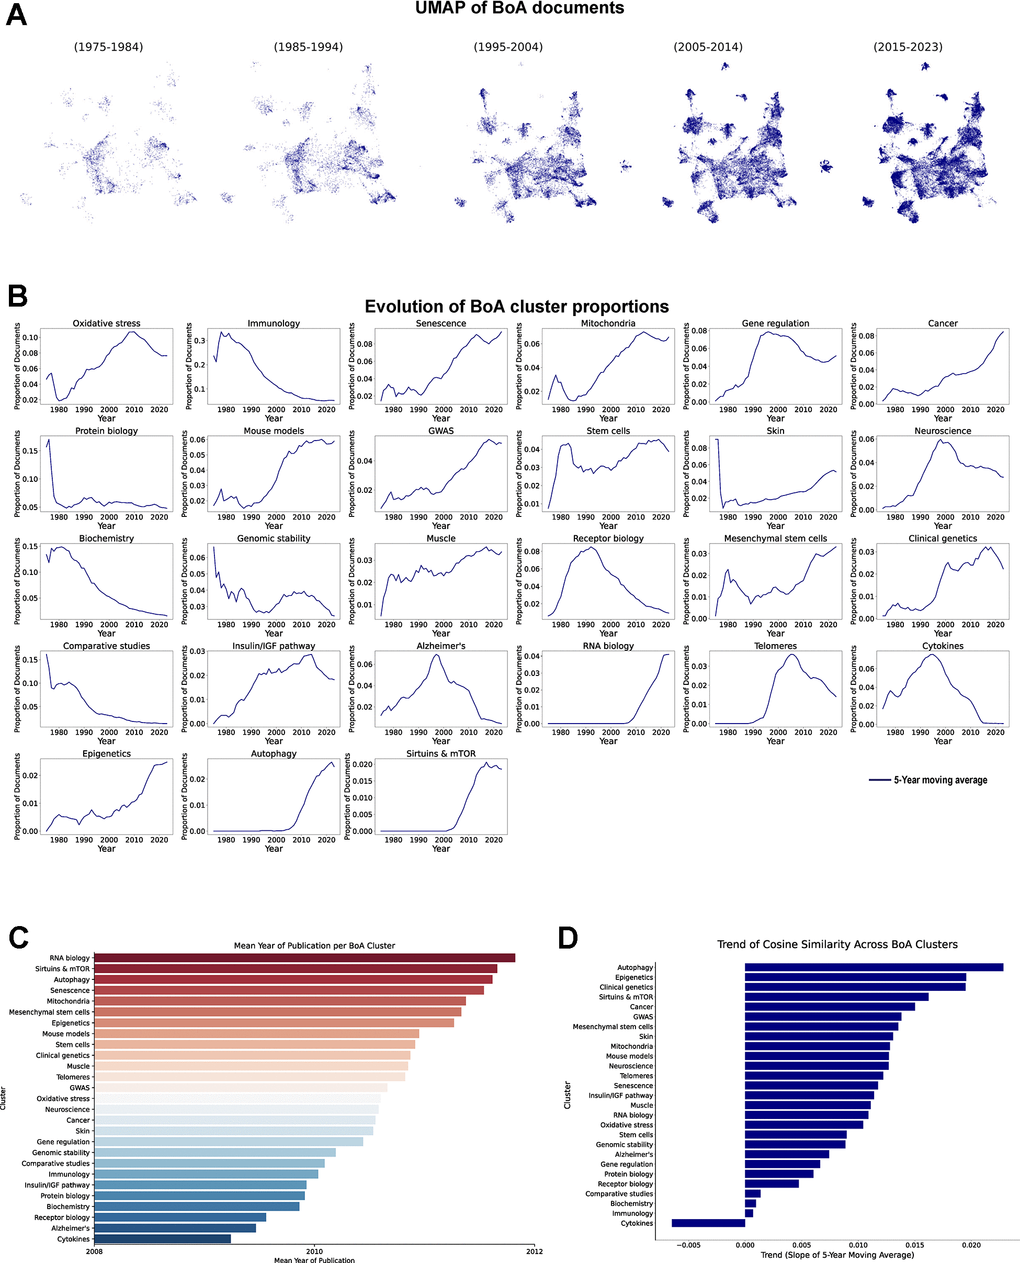
Figure 5.Temporal evolution of BoA research clusters. (A) UMAP of vectorized documents distributed in decades. (B) Evolution of BoA cluster proportions, each line represents the 5-year moving average of each cluster proportion (1975-2023). (C) Mean publication year of the documents in each cluster. (D) Cosine similarity trend analysis across clusters, results represent the slope of the 5-year moving average of the changes in cosine similarity within each cluster (1975-2023).