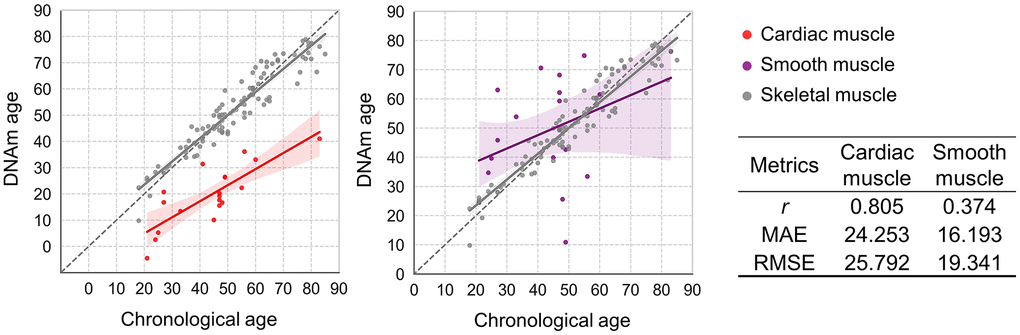
Figure 5.Applicability of the best-performing SBE model to cardiac and smooth muscle tissues. Plots compare DNAm age and chronological age using the best SBE model across tissue types. Left: skeletal (gray) vs. cardiac muscle (red, n = 19); right: skeletal vs. smooth muscle from uterus (purple, n = 19). Skeletal muscle samples (n = 103) are shown in gray on both plots. Solid lines represent the regression relationships for each tissue type, with 95% confidence intervals shaded in corresponding colors. Performance metrics for each tissue are summarized in the accompanying table.