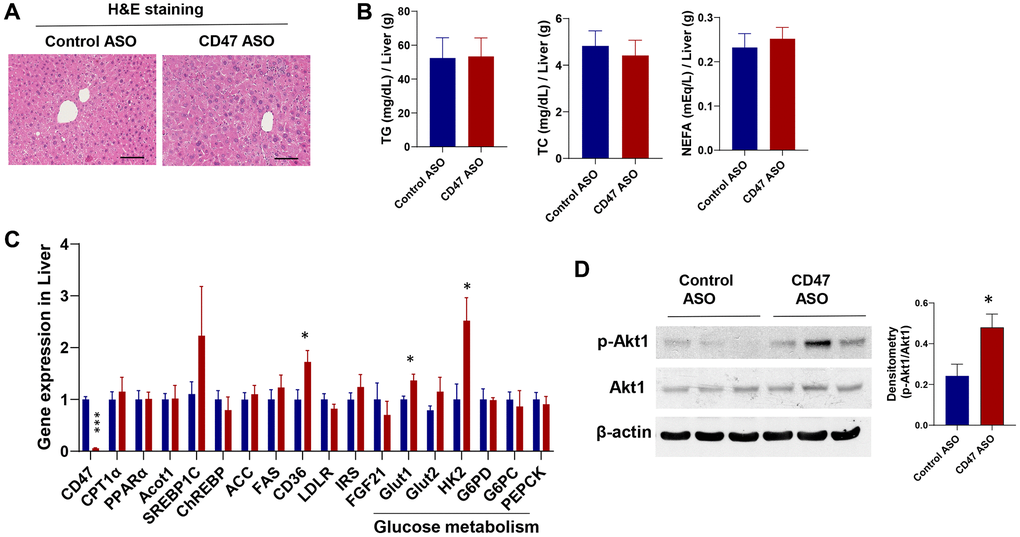
Figure 6.Effect of CD47 ASO treatment on liver histology and gene expression in aged male mice. (A) Representative H&E staining image of liver (scale bar = 100 μm); (B) Hepatic lipid levels including triglycerides, total cholesterol, and free fatty acid; (C) Gene expression in liver by qPCR; (D) Representative hepatic immunoblotting of p-AKT1, total AKT, and β-actin, with corresponding densitometry results. Data are represented as mean ± SEM (n = 6 mice/group). *P < 0.05 and ***P < 0.001 compared to control group.