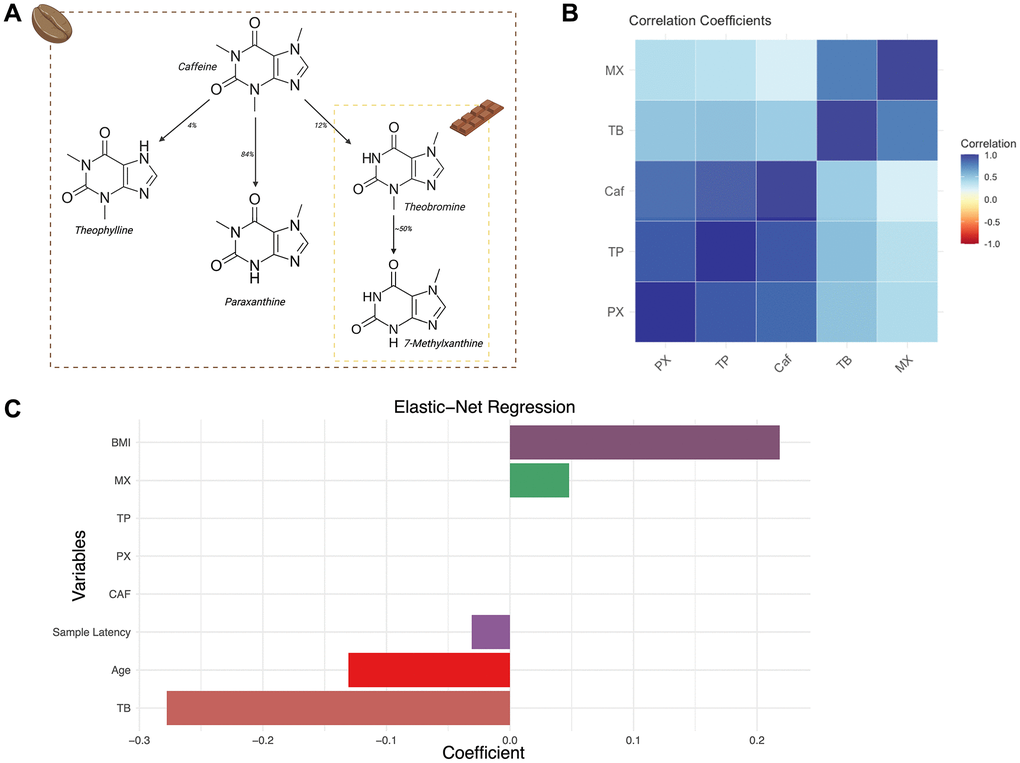
Figure 1.Major dietary sources of methylxanthines and their correlations in the TwinsUK sample. (A) Schematic presenting key methylxanthines, their respective dietary sources and their derivation as secondary metabolites. (B) Correlation heatmap of coffee-related metabolites in the TwinsUK sample. (C) Bar plot representation of the Elastic-net Regression coefficients with 10-fold cross-validation of variables against GrimAgeAccel in the TwinsUK sample.