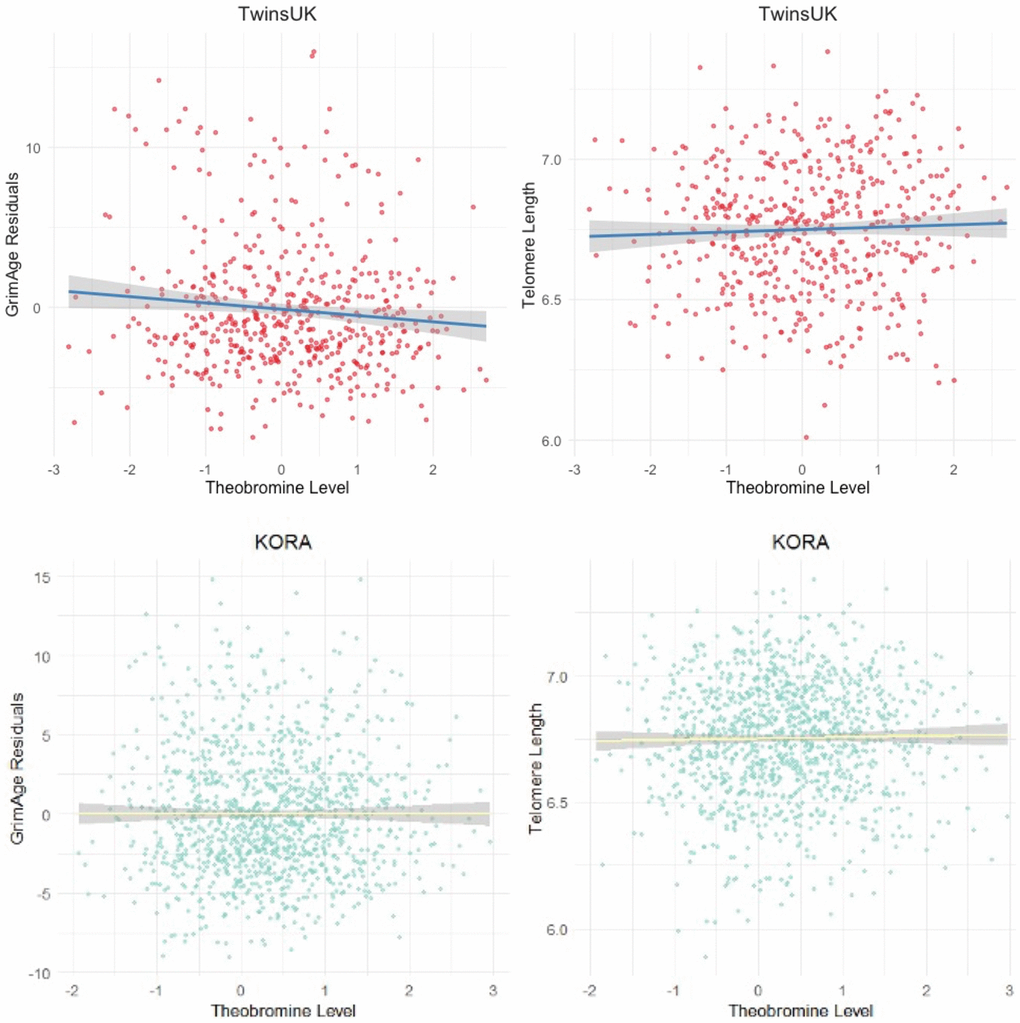
Figure 2.The association between TB and epigenetic age in the TwinsUK and KORA cohort samples. Scatter plots of the GrimAge acceleration residuals (top left, primary analysis B = −1.576, p = 3.99 × 10⁻⁶) and epigenetic estimate of telomere length, DNAmTL (top right, primary analysis B = 0.036, p = 0.003), in the discovery TwinsUK sample of 509 females. Bottom row plots show results for the KORA sample of 1,160 individuals for GrimAge acceleration residuals (bottom left, primary analysis B = −1.06, p = 7.2 × 10⁻⁶) and DNAmTL (bottom right, primary analysis B = 0.022, p = 0.007).