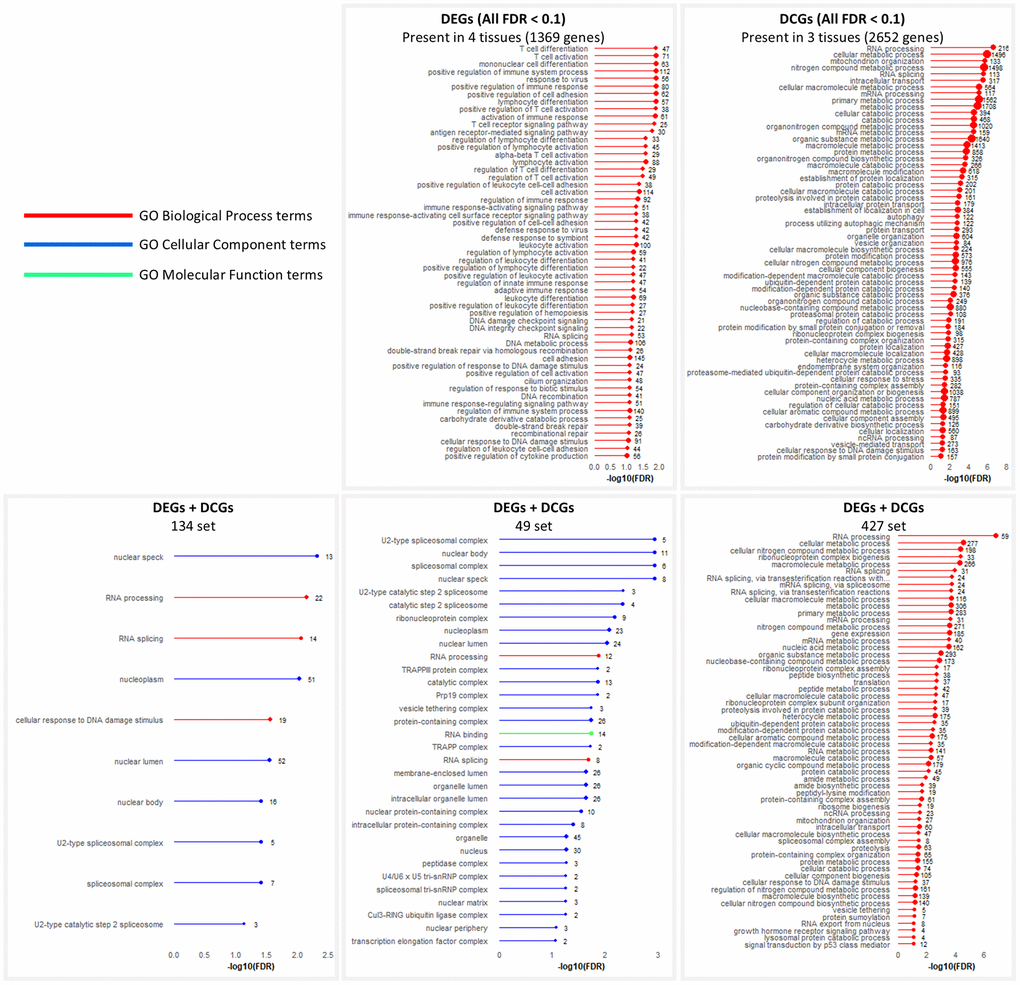
Figure 3.GO enrichment analysis of intersection sets. Terms significant at FDR < 0.1. In cases where too many terms were enriched, only Biological Process terms are shown. When that still yielded too many results, further filtering was performed by removing terms with the least number of genes.