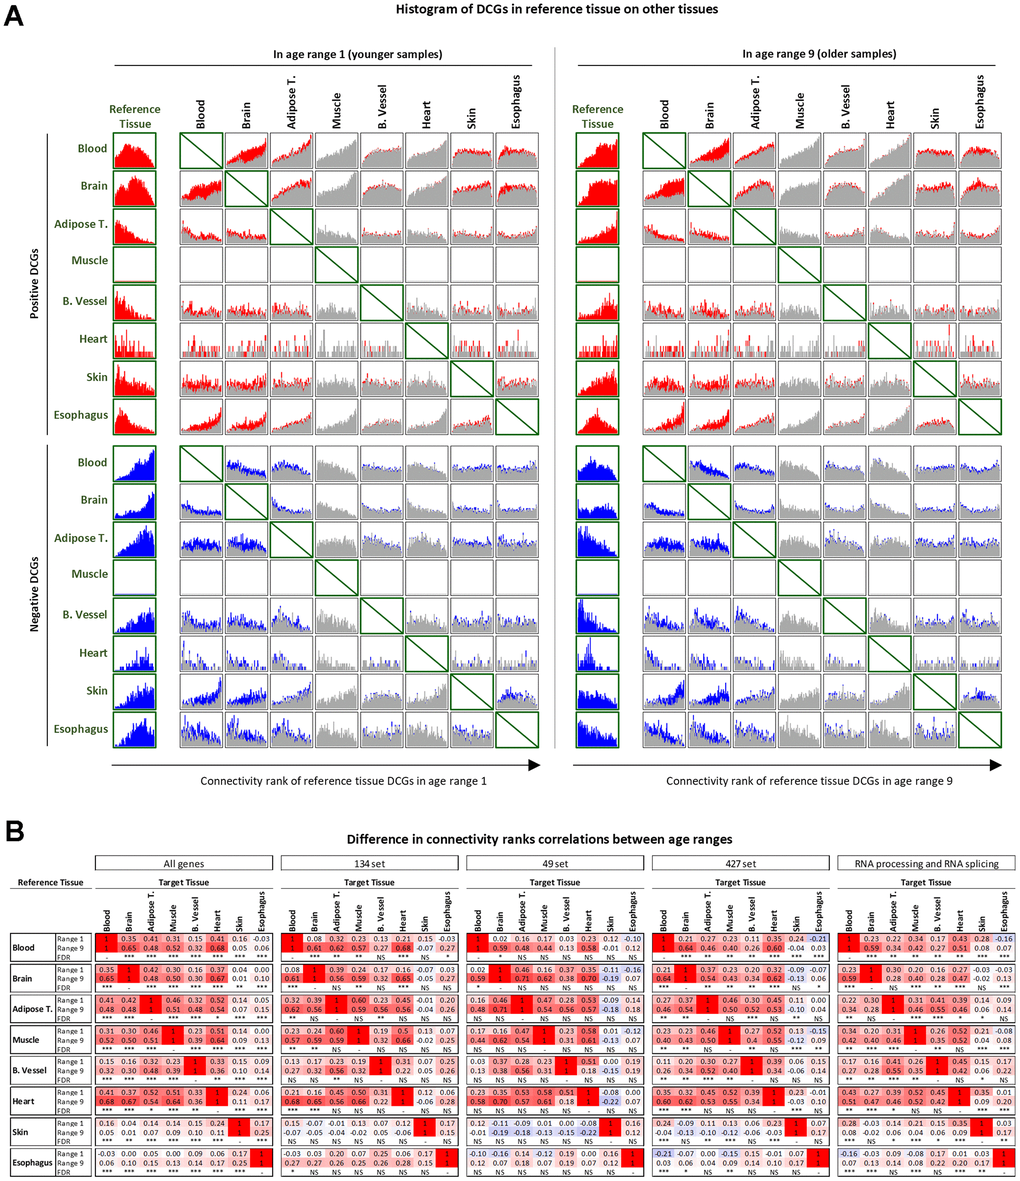
Figure 4.Cross-tissue analysis of DCGs. (A) DCGs in reference tissues projected on other tissues in younger and older samples. Colored portions of the histogram represent positive (red) or negative (blue) genes DCGs in the reference and target tissue. Grey portions represent genes that are DCGs in the reference tissues but not in the target tissue. (B) Comparison of changes in correlations of connectivity ranks between younger and older samples. Significance levels: FDR<0.1 (*), FDR<0.01 (**), FDR<0.001 (***).