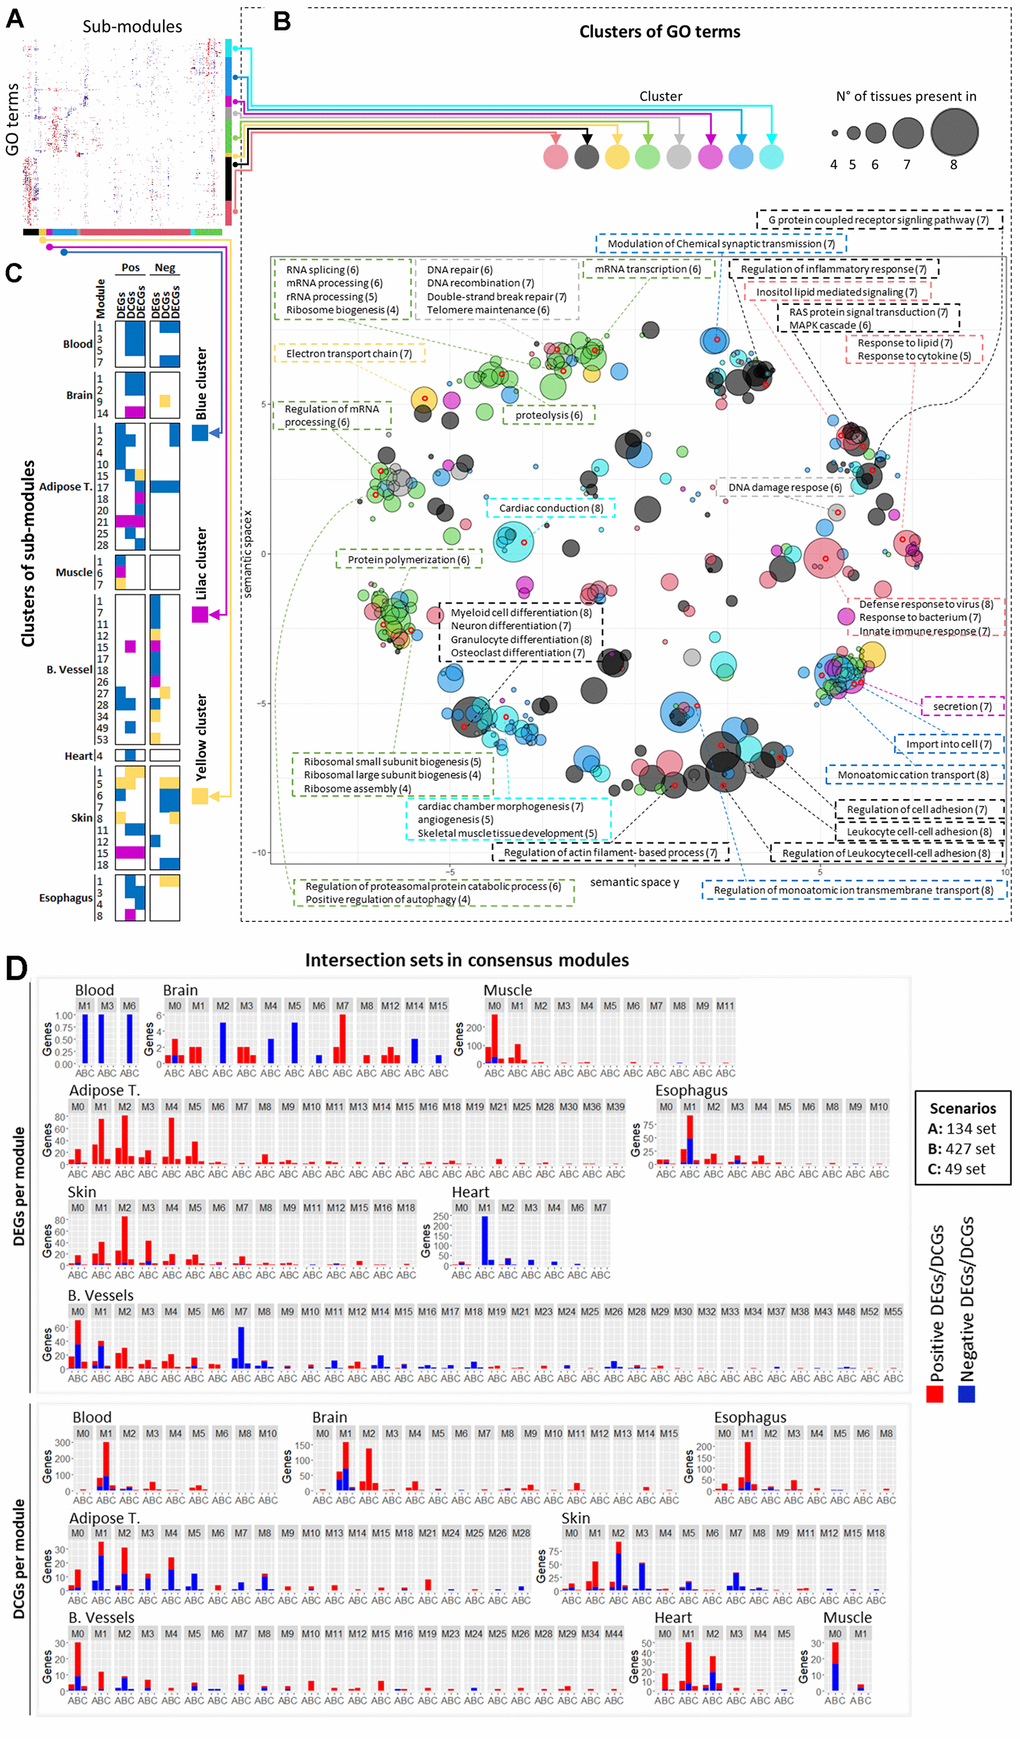
Figure 5.Consensus modules analysis. (A) Unlabeled heatmap of similarity between terms enriched in sub-modules. (B) Semantic similarity of the terms in the heatmap with Revigo. The size of the dots on the chart represents the number of tissues in which that term is found, and the coloring of the dot represents the cluster of terms/rows in which that term is found. The size and coloring are based on the term chosen to represent the cluster. Terms contained in some points in different regions of the chart are highlighted and described in the text boxes. The numbers in parentheses next to the terms represent the number of tissues in which that term is enriched (which may or may not be equal to the value for the representative term of the same point). (C) Sub-modules enriched in terms contained in the green and gray terms/rows clusters. (D) Overlap between consensus modules and genes in the intersection sets. The red and blue portions of the bars represent positive and negative DEGs/DCGs.