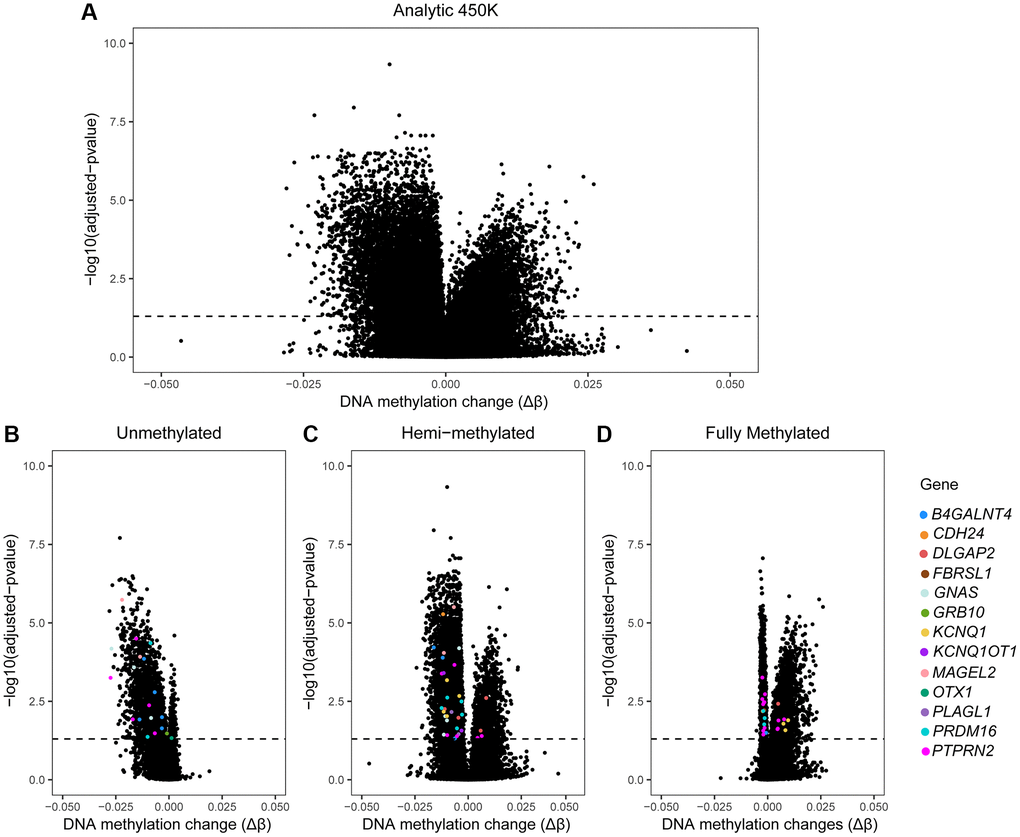
Figure 2.Volcano plots of 450K data by age in sperm. Volcano plots of our age-association study on the 450K array. X-axis: Delta β-values (Δβ) representing age-associated changes in DNA methylation (after linear regression, adjusted for BMI and patient status). Y-axis: logarithmic transformation of the adjusted p-value (BH-method). Dashed line: indicates where the adjusted p-value is 0.05; dots above the dashed line represent CpG sites where sperm DNA methylation is significantly associated with male age. (A) All sites of the 450K are included (n = 482,287) and dots above the dashed line are age-associated DMCs (n = 14,622). (B–D) Volcano plots by subgroup of DNA methylation. Colored dots: significant age-related DMCs mapped to genes selected by their potential role in inheritance of ASD from father to child; these include: OTX1, PRDM16, PTPRN2, B4GALNT4, KCNQ1, KCNQ1OT1, DLGAP2, PLAGL1, GNAS, GRB10, MAGEL2, CDH24 and FBRSL1. Each colored dot represents one DMC; multiple dots with same color are allocated to the same gene.