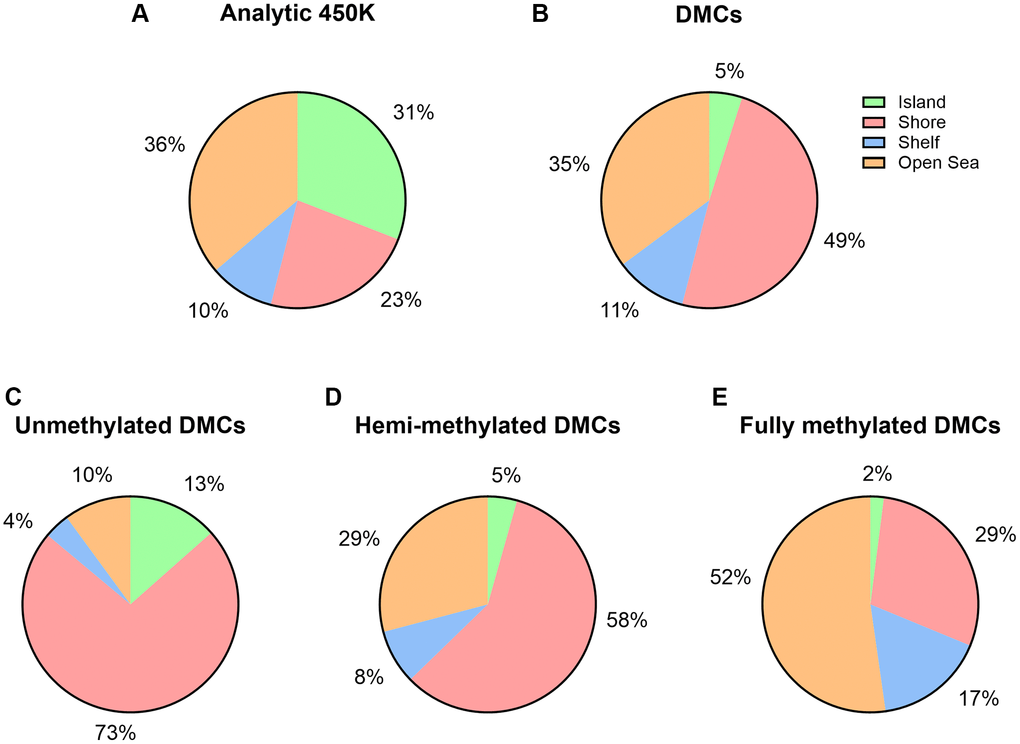
Figure 4.Island content of CpGs within 450K array and age-associated DMCs. (A) Percentages of CpGs by island content are displayed with respect to the 450K (n = 482,287). (B) Percentages of CpGs by island content are displayed with respect to the number of significant age-related DMCs (n = 14,622). (C–E) By DNA methylation subgroup (Abbreviations: UM: unmethylated, mean β-value <0.2; HM: hemi-methylated, 0.20 ≤ mean β-value ≤0.80; FM: fully methylated, mean β-value>0.80).