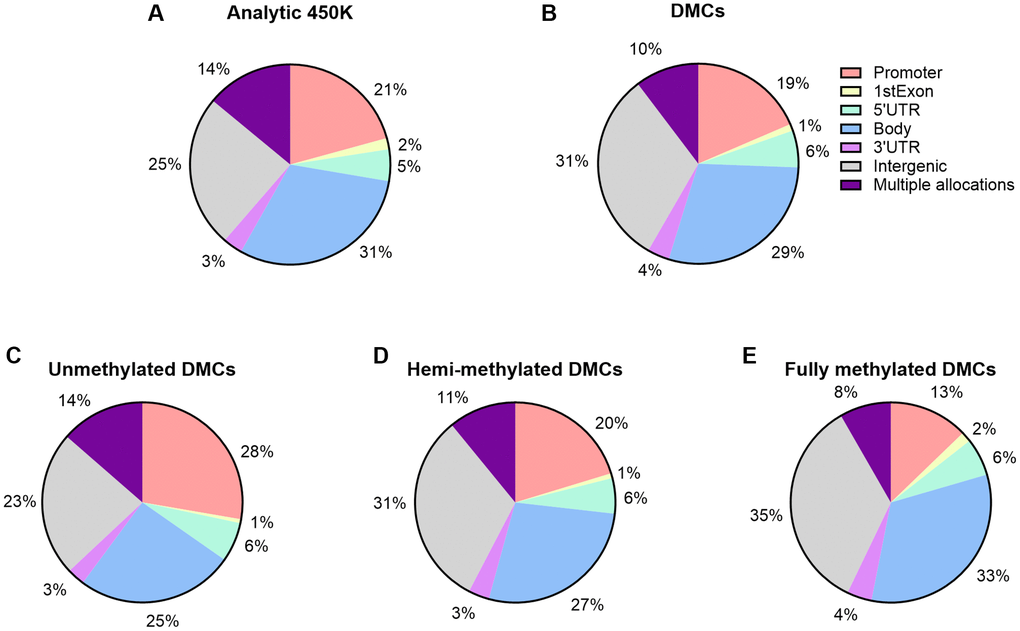
Figure 5.Functional genomic distribution of CpGs within 450K array and age-associated DMCs. (A) Percentages of CpGs by functional genomic region are displayed; by promoter, 1stExon, 5′UTR, 3′UTR, body, and intergenic regions. CpG sites allocated to multiple regions are reported as a separate category. (A) Percentages with respect to the 450K (n = 482,287). (B) Percentages are displayed with respect to the number of significant age-related DMCs (n = 14,622). (C–E) By DNA methylation subgroup (Abbreviations: UM: unmethylated, mean β-value <0.2; HM: hemi-methylated, 0.20 ≤ mean β-value ≤0.80; FM: fully methylated, mean β-value >0.80).