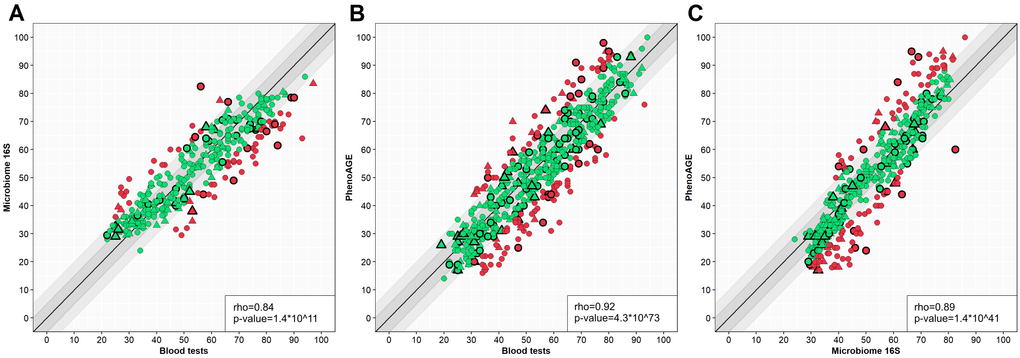
Figure 6.Scatter plots of different model results comparison. Y-axis – one model, X-axis – another model. Circle – women, triangle – men. Green – case in a 10-year spread, red – out of spread. Points with border – test set cases. (A) – blood tests model versus microbiome model, (B) – blood tests model versus PhenoAge, (C) – microbiome model versus PhenoAge. Outlined shapes – test subset samples. The correlation coefficients are presented for the test set.