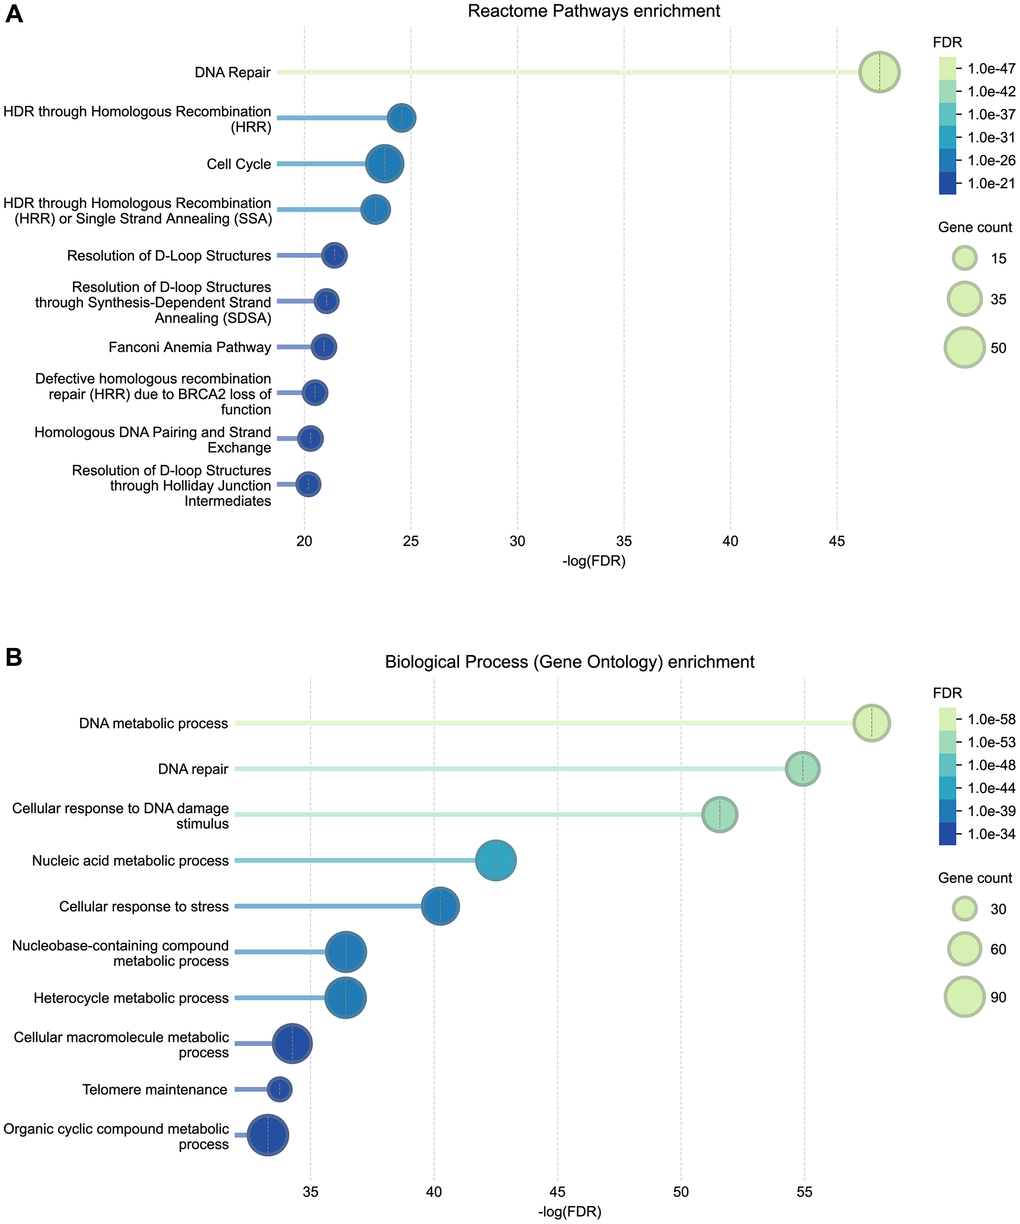
Figure 4.Reactome pathway (A) and Gene Ontology (GO) Biological Process (B) functional enrichment of genes associated with progeroid syndromes. Bubble plots show the top ten enriched biological pathways and processes identified from STRING’s functional enrichment outputs. The x-axis represents the –log(FDR) significance of enrichment. Bubble size corresponds to the number of genes annotated to each pathway/process, and bubble color reflects the adjusted FDR value. Complete enrichment results are provided in Supplementary Tables 3 (GO) and 4 (Reactome).