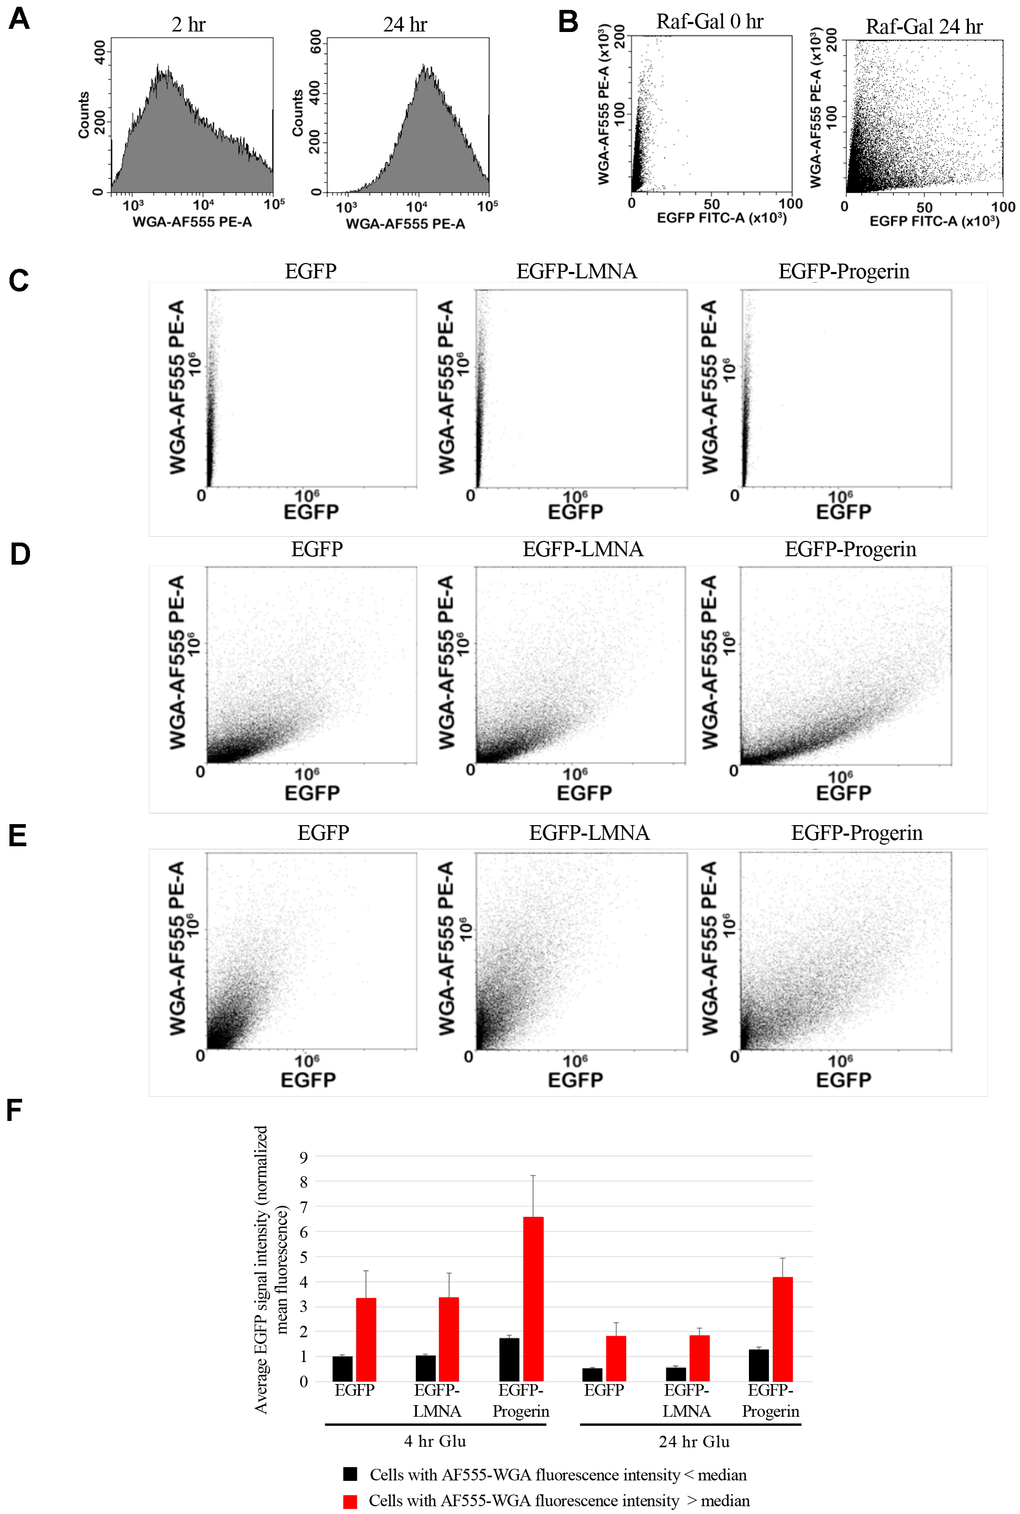
Figure 5.EGFP and bud scar signal can be measured by flow cytometry. (A) To quantify bud scar signal by flow cytometry, cells were fixed and labelled with WGA conjugated to Alexa-555 dye (WGA-AF555). Representative histogram of the cell counts (y-axis) from untransformed cultures against intensity of label at 2h and 24 hours. The shift in the histogram represents increased average signal as the cultures age, correlated with higher average numbers of bud scars per cell, and therefore higher WGA-AF555 labelling. (B) Cells from cultures either immediately prior to induction (RAF GAL-0H) or after 4h incubation in RAF/GAL induction medium (RAF GAL-4H) were fixed and labelled with WGA-AF555. Flow cytometry was used to quantify EGFP signal (EGFP-FITC-A) and the WGA-AF555 signal (WGA-AF555-PE-A), demonstrating the detection of cells with higher levels of EGFP expression at the right of the panel and cells with higher intensity of bud scar labelling at the top of the panel. (C–E) EGFP (left column), EGFP-LMNA (middle column), and EGFP-Progerin (right column) expressing yeast were fixed for flow cytometry analyses; (C) prior to induction of fusion protein expression, (D) after 4 h of induction, and (E) and after 24 h incubation in media containing glucose following induction. Y-axis represents the intensity of WGA-AF555 signal, and the x-axis represents the intensity of EGFP signal. (F) Statistical data from the flow cytometry shown in panel A was used to analyze the average EGFP intensity of cells either immediately following 4 h induction in RAF/GAL medium (EGFP-0H-GLU, EGFP-LA-0H-GLU, and EGFP-D50-0H-GLU) or after 24 h in glucose containing medium (EGFP-25H-GLU, EGFP-LA-24H-GLU, and EGFP-D50-24H-GLU). Average EGFP signal intensity (normalized mean fluorescence) of younger cells showing less than the median WGA-AF555 intensity (black bars) or in older cells exhibiting greater than the median WGA-AF555 signal (red bars) was plotted. Error bars represent the standard error of the mean.