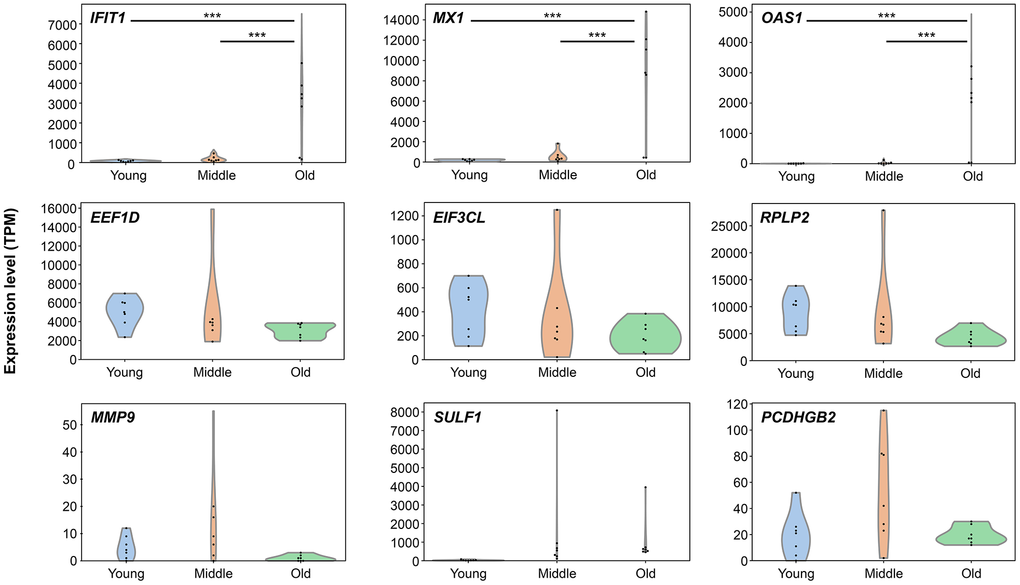
Figure 7.Senescence-stage-dependent expression patterns of representative genes. Violin plots showing transcript expression levels (TPM) of nine selected genes across three senescence stages: young, middle, and old. Genes include IFIT1, MX1, OAS1 (Meta2), EIF3CL, EEF1D, RPLP2 (Meta4), and MMP9, SULF1, PCDHGB2 (Meta6). Each plot displays the distribution and individual data points. Statistical significance was assessed using one-way analysis of variance followed by Tukey’s post-hoc test. Asterisks indicate significant differences between groups: *p < 0.05, **p < 0.01, ***p < 0.001.