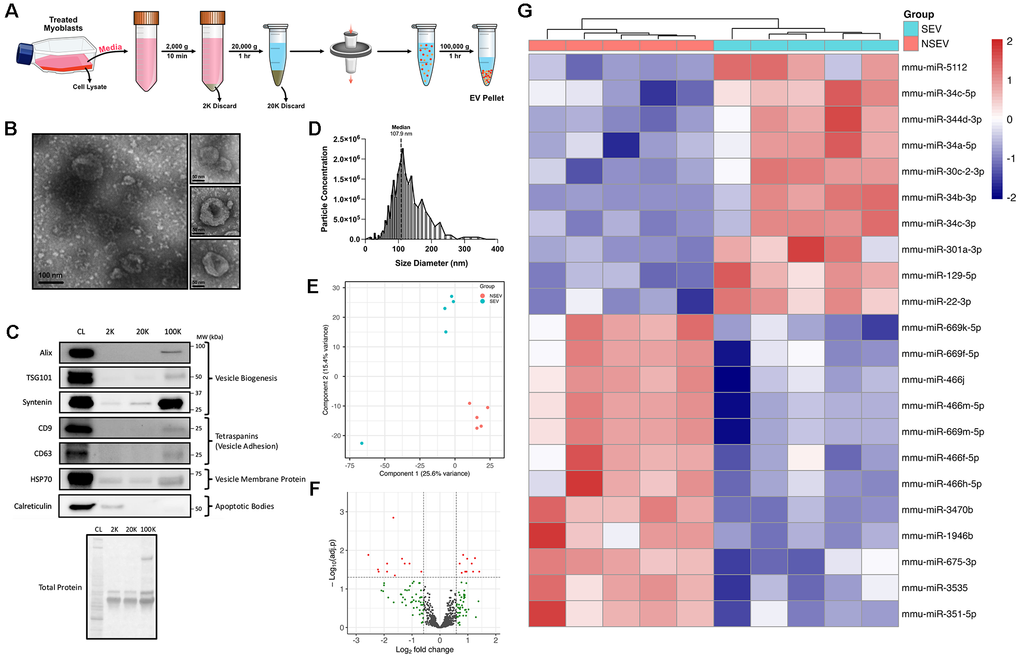
Figure 2.MiRNA expression profile of EVs released by senescent myoblasts. (A) Schematic diagram of the isolation of extracellular vesicles from the conditioned media of VEH- or BLEO-treated myoblasts. (B) Transmission electron micrographs of isolated EVs. Scale bars represent 100 nm and 50 nm. (C) Representative western blots of EV-specific markers (Alix, TSG101, Syntenin, CD9, CD63, HSP70) and endoplasmic reticulum contamination markers (Calreticulin) measured in the cell lysate (CL), post-2000g spin discard (2K), post-20,000g spin discard (20K), and the concentrated EV pellet (100K). Blots have been cropped to improve clarity and conciseness of the results. (D) EV size and concentration distribution, as measured by nanoparticle tracking analysis. (E) Principal component analysis (PCA) of SEN-derived EVs (SEV; cyan) and NSEN-derived EVs (NSEV; orange). (F) Volcano plot of differentially expressed (DE) miRNAs based on adj. p < 0.05 and FC ≥ |1.5|. Red dots indicate significant DE miRNAs, while green dots are non-significant with FC ≥ |1.5| and adj. p > 0.05. (G) Heatmap showing all DE miRNA (adj. p < 0.05 and FC ≥ |1.5|) with hierarchal clustering of SEV and NSEV samples.