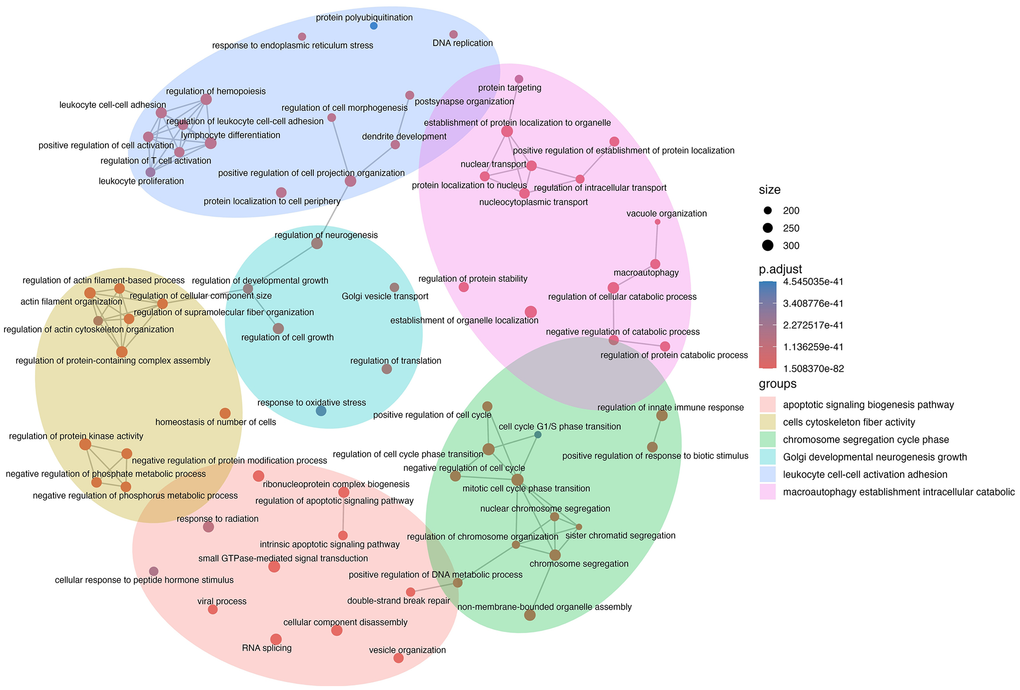
Figure 3.Network mapping of biological processes implicated by senescent EV miRNAs. Validated gene targets of differentially expressed miRNAs were analyzed for gene ontology (GO) terms related to biological processes. GO terms were clustered into groups and mapped using the R function emapplot in the enrichplot package. Node size is proportional to the number of gene targets found in each term, and node colour is related to the adjusted p-value.