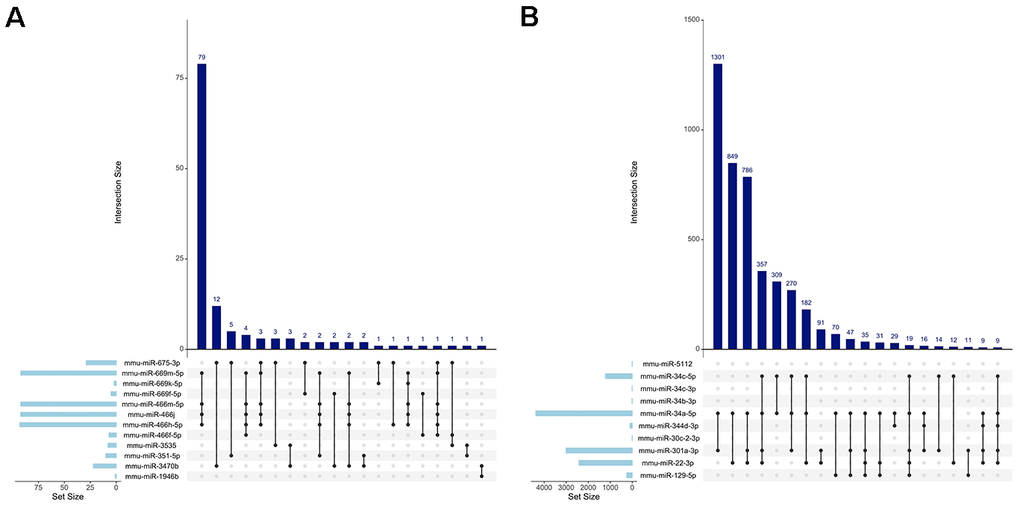
Figure 4.Visualization of miRNA gene target intersections. Upset plots depicting the number of shared gene targets between all the (A) downregulated miRNAs and (B) upregulated miRNAs. The vertical bars display the size of each intersection, while the horizontal bars represent the size of each miRNA set. The connected dots below the vertical bars indicate which sets of miRNAs are included in that intersection.