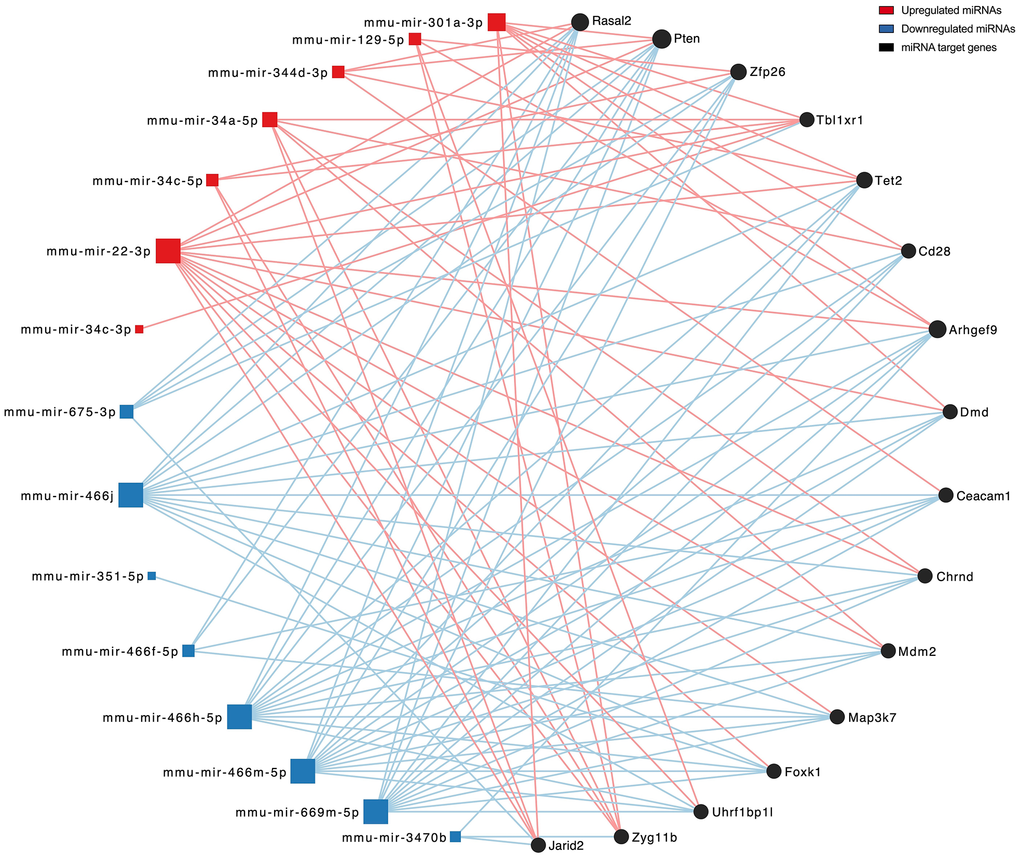
Figure 5.Network mapping of DE miRNAs and their topmost targeted genes. A visualization of upregulated (red) and downregulated (blue) miRNAs and the target genes they interact with. Node size is proportional to the degree value of connectivity. The network was degree filtered with a cut-off of 5 to display the top miRNA-targeted genes.