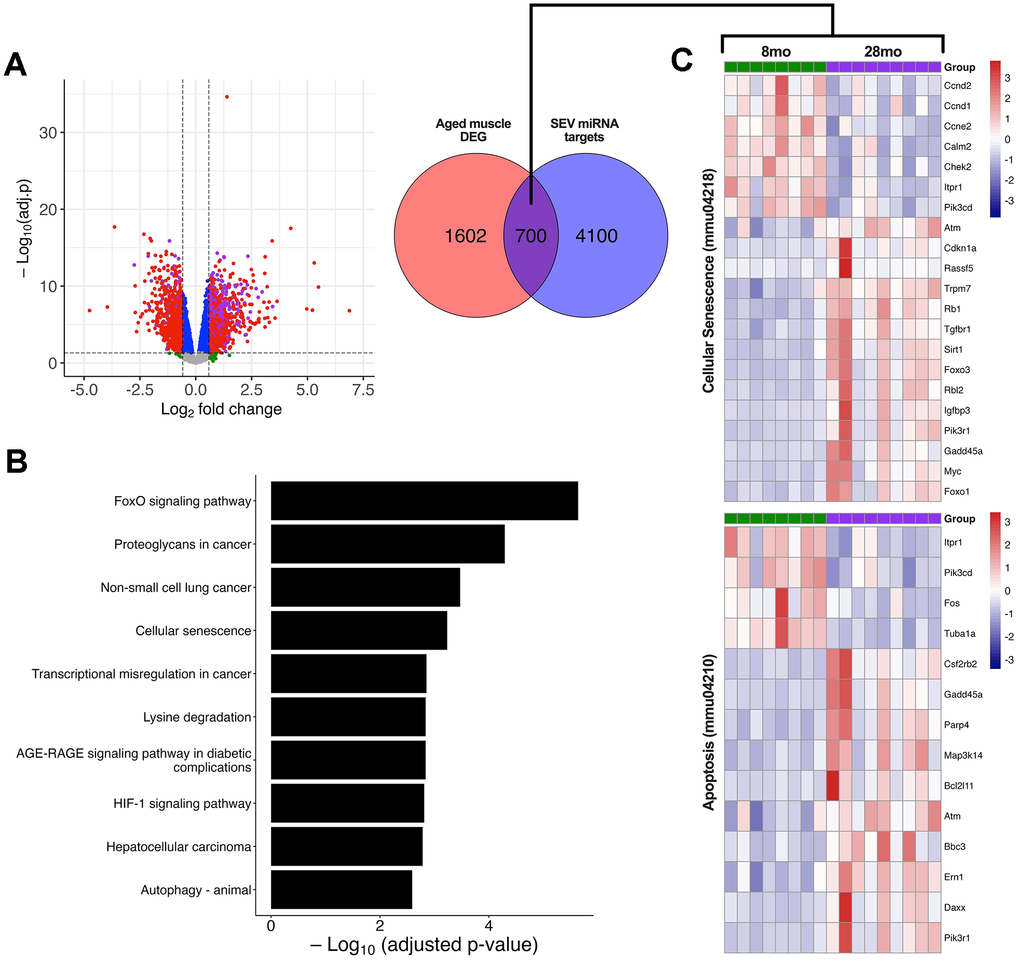
Figure 7.Association of SEV-derived miRNAs with the transcriptomic profile of geriatric mouse muscle. RNA-seq data of gastrocnemius muscle from young (8mo; n = 8) and geriatric (28mo; n = 9) C57BL mice. (A) Volcano plot of differentially expressed genes (DEG) based on adj. p < 0.05 and FC ≥ |1.5|. Red dots indicate significant DEG, while purple dots are significant DEG that are validated gene targets of SEV miRNA. Green dots are non-significant with FC ≥ |1.5| and adj. p > 0.05. A Venn diagram illustrates the overlap (purple) between aged gastrocnemius DEG and genes targeted by two or more DE miRNAs within SEV. (B) KEGG enrichment analysis of overlapping geriatric DEG and SEV miRNA targets. The top 10 significant pathways are plotted in descending order by adj. p-value. (C) Heatmap showing gene expression data from 8mo and 28mo gastrocnemius muscle for two significant KEGG pathways, cellular senescence (mmu04218) and apoptosis (mmu04210). All genes displayed are significant (FDR < 0.05 and FC ≥ |1.5|) and validated targets of 2 or more SEV miRNA. RNA-seq data was obtained from publicly available data (GSE145480) [26].
Figure 7 — Extracellular vesicles released by senescent myoblasts affect recipient cells via miRNA-target interactions | Aging