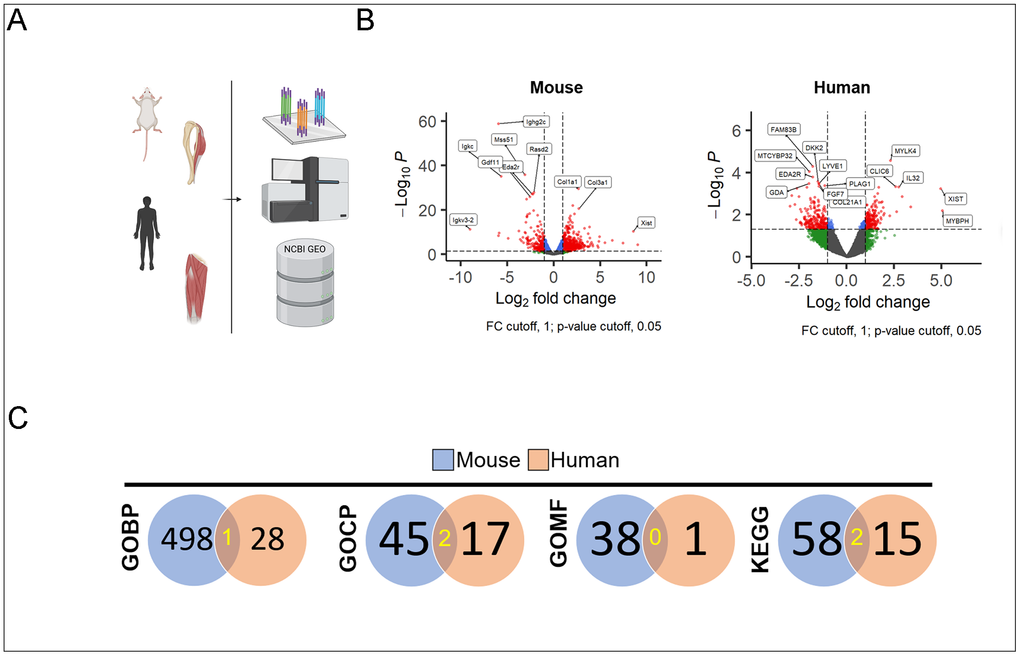
Figure 1.Schematic of mouse and human bulk-seq analysis and processing (A). Volcano plots demonstrate those with statistical significance and absolute value of fold change >1 (red) in mouse (left) and human (right) muscles (B). Counts of statistically significant enrichment terms derived from upregulated DEG in both old vs. young mice (blue circle) and humans (red circle) with the number of overlapping terms highlighted in yellow (C).