Submit an Article
Navigate
Home
Editorial Board
Editorial Policies
Current Volume
Archive
Scientific Integrity
Publication Ethics Statements
Interviews with Outstanding Authors
Newsroom
Sponsored Conferences
Podcast
Contact
Special Collections
Submit an Article
Online ISSN: 1945-4589
Research Paper
|
Volume 18
|
pp. 575–592
Transcriptional programs diverge in aging mouse and human skeletal muscle
Back to article
Figure 3
(3 of 4)
−
100%
+
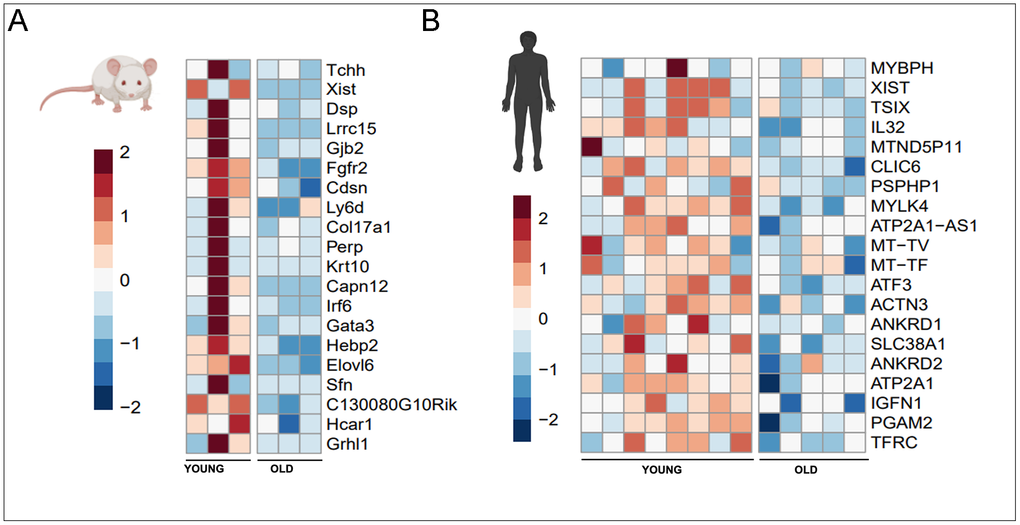
Figure 3.
20 genes with greatest decrease in expression with aging in mice (
A
) and human (
B
) muscle.