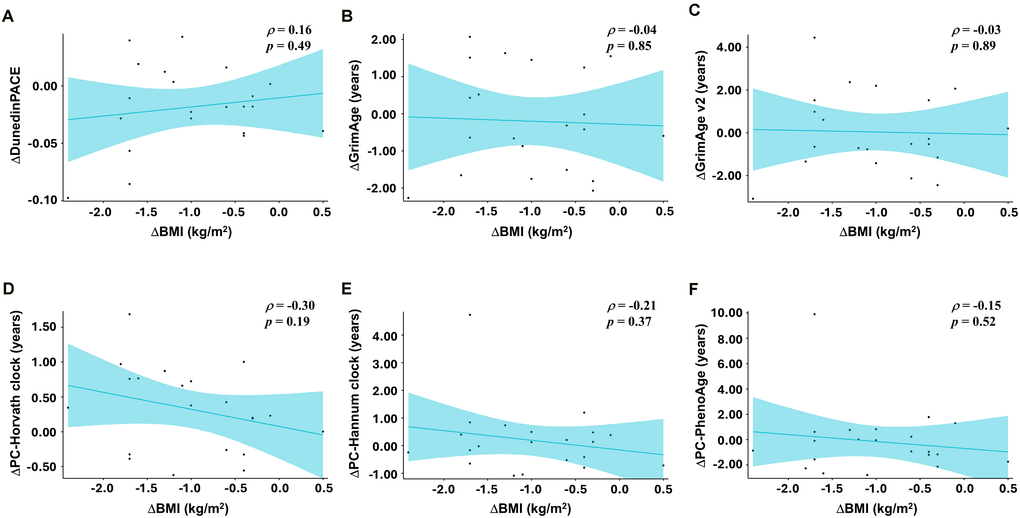
Figure 3.Correlation between changes in body weight and DNAm-based aging measures. Scatter plots illustrating associations between changes in body mass index (ΔBMI, kg/m2) and changes in DNA methylation-derived age acceleration (week 12 minus baseline) in the INT group (n = 21). Each point represents an individual participant; solid lines depict simple linear regression fits, shown for visualization only. Pearson correlation coefficients (p) and corresponding p-values are shown in each panel. Panels show; (A) ΔDunedinPACE vs. ΔBMI; (B) ΔGrimAge vs. ΔBMI; (C) ΔGrimAge v2 vs. ΔBMI; (D) ΔPC-Horvath clock vs.ΔBMI; (E) ΔPC-Hannum clock vs. ΔBMI; (F) ΔPC-PhenoAge vs. ΔBMI.