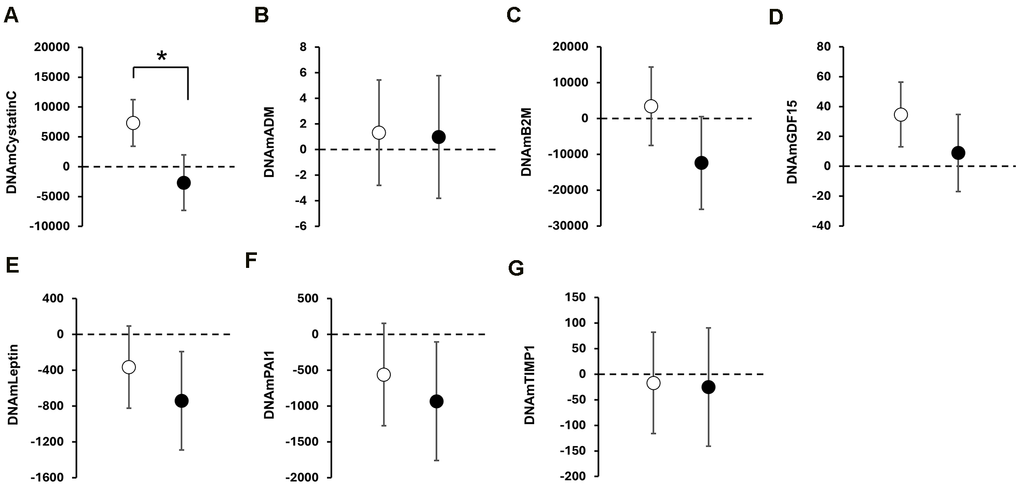
Figure 4.Exploratory analyses of DNAm-based surrogate biomarkers of GrimAge. Data are presented as adjusted mean value in DNAm-based surrogate biomarkers of GrimAge with 95% confidence intervals (CI) at post-intervention. Open and black circles represent an adjusted mean value in the CON and INT group, respectively. Scale bars show 95% CI. The dotted line indicates zero. Asterisks (*) indicate significant between-group differences by ANCOVA. Panels show; (A) DNAmCystatinC; (B) DNAmADM; (C) DNAmB2M; (D) DNAmGDF15; (E) DNAmLeptin; (F) DNAmPAI1; (G) DNAmTIMP1.