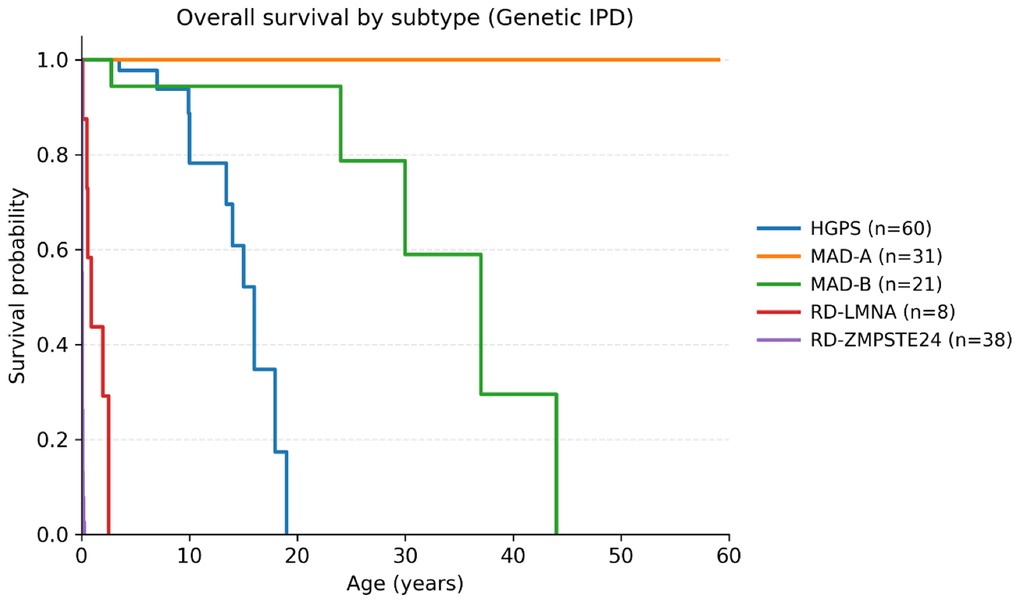
Figure 2.Kaplan–Meier overall survival by subtype (genetically confirmed IPD). Kaplan–Meier survival curves for HGPS, MAD-A, MAD-B, RD-LMNA and RD-ZMPSTE24 in the primary cohort of genetically confirmed IPD. Tick marks indicate censored observations. Numbers at risk are shown beneath the x-axis at prespecified ages. Global and pairwise log-rank tests are reported in Supplementary Table 4. A supplementary sensitivity Kaplan–Meier analysis is provided in Supplementary Figure 3.
Figure 2 — Life expectancy and causes of death in classical laminopathic progeroid syndromes: systematic review with individual-patient data synthesis | Aging