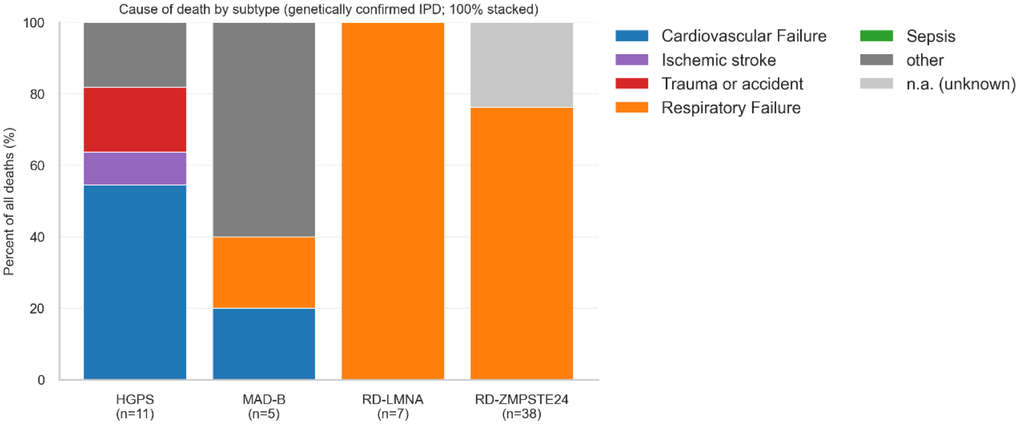
Figure 3.Cause of death by subtype (Genetically confirmed IPD; 100% stacked). Each bar shows the relative composition (100%) of all deaths by cause category within each subtype. Numbers below the x-axis indicate deaths per subtype. Categories are mutually exclusive and coded according to prespecified rules (Supplementary File 7). Exact counts and percentages are provided in Table 2.