


Introduction
Lung cancer is the leading cause of cancer-related death worldwide, with 1.8 million new cases and 1.6 million deaths reported in 2012 [1–3]. Only 16% of early-stage lung cancer is diagnosed, and the overall 5-year survival rate is only 15% [4]. Even after curative resection and systemic chemotherapy, a significant number of lung cancer patients die due to recurrence and distant metastases. Therefore, the identification of novel therapeutic targets to improve survival of lung cancer patients is urgently needed.
Rab1A, a small GTPase, has been well established to mediate vesicular trafficking between the endoplasmic reticulum (ER) and Golgi apparatus [5]. It is a highly conserved protein, which has been identified in 158 different organisms, ranging from yeast to humans [6,7]. Recently, a growing body of evidence has suggested that the Rab1A protein has additional functions beyond its role in vesicular transport, including nutrient sensing [8] and signaling [9], cell migration [10] and regulation of autophagy [11]. Moreover, aberrant expression of Rab1A has been linked to a range of human diseases including cardiomyopathy [12], Parkinson’s disease [13] and cancer [8,14–19].
Rab1A has been identified as a colorectal oncogene, and elevated expression of Rab1A has been reported in multiple cancer types, including colorectal cancer (CRC) [8], hepatocellular carcinoma (HCC) [18], glioma [14], prostate cancer [15,17], tongue squamous carcinoma [16] and cervical cancer [19]. Overexpression of Rab1A is correlated with a poor prognosis and has been proposed to promote tumor progression by activating the mTORC1 signaling pathway in CRC and HCC, indicating that Rab1A might be a valuable therapeutic target for personalized therapy [8]. Despite the importance of Rab1A in human malignancies, to date, Rab1A has not been studied in the context of lung cancer. In this study, we investigated Rab1A expression in tissues and cell lines from different lung cancer subtypes, and assessed the relationships between Rab1A expression and clinical parameters as well as key cancer cell signaling pathways.
Results
Rab1A is highly expressed in lung cancer tissues
Immunohistochemical staining was performed to evaluate Rab1A expression in 60 lung cancer tissues and paired adjacent noncancerous tissues. Positive staining appeared brown. Rab1A was predominantly expressed in the cytoplasm, and the percentage of nuclear expression is very low (less than 5%) in both noncancerous tissues and cancerous tissues. In contrast to the noncancerous tissues, Rab1A was significantly highly expressed in tumor cells (Figure 1A), while faint staining was present in stromal and lymphoid cells in paired noncancerous tissues. When using the median H score of 67.5 as a cutoff value, the overall rate of positive staining in lung cancer tissues (95%) was significantly higher than in paired noncancerous tissues (5%; P = 0.000; Table 1). Compared with matched noncancerous tissues (median H score = 15), Rab1A staining was much stronger in lung cancer tissues (median H score = 189; Figure 1B). On an individual basis, Rab1A scored higher in approximately 96.67% (58/60) of tumors than in the corresponding noncancerous tissues, although Rab1A staining was remarkably variable, differing by as much as 100-fold between different tumor samples (Figure 1C). For different histological subtypes of lung cancer, Rab1A showed similar expression patterns (Figure 1D) with a 100% positive staining rate in adenocarcinoma, adenosquamous carcinoma and large cell lung cancer tissues (Table 2). The H score in the adenocarcinoma group (median, 211.5) was higher than others histological types while the small cell lung cancer cohort showed the lowest H score (median, 121.5; Figure 1E).
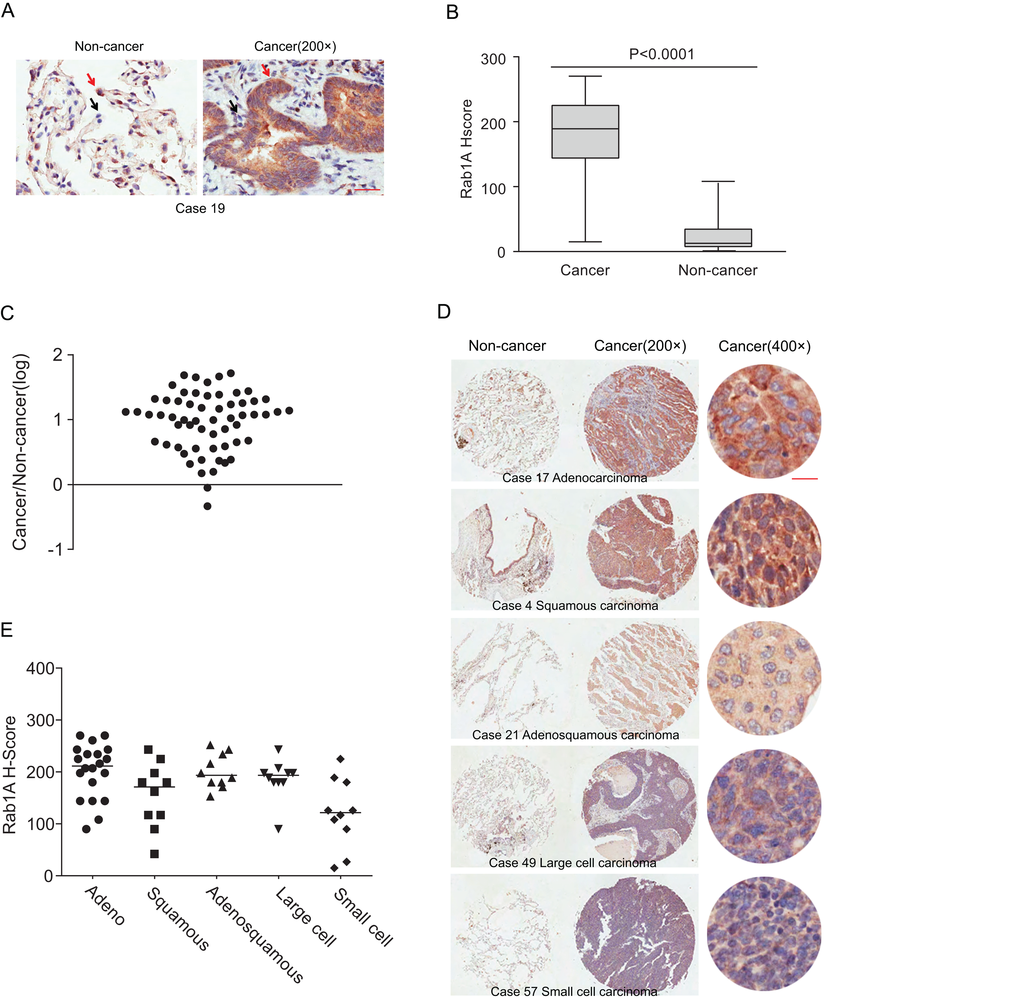
Figure 1. Rab1A is frequently overexpressed in different histological types of lung cancer. (A) IHC staining of human lung cancer tissue and noncancerous tissues. Shown are representative images of stained tumor and non-cancerous tissue sections. Red arrowhead: high Rab1A staining; black arrowhead: low Rab1A staining. Scale bar = 50 µm. (B) Box plot graph showing the statistical analysis of Rab1A expression in lung cancer and paired non-cancerous tissues. (C) Scatter plot showing Rab1A staining levels in individual tumors as a ratio of Rab1A staining in lung cancer to the paired non-cancerous tissue. (D) IHC staining of human lung cancer tissue microarray and paired noncancerous tissues. Shown are stained tumor and non-cancerous tissue sections representative of different histological types. Scale bar = 20 µm. (E) Scatter plot showing levels of Rab1A staining in different histological types of lung cancer as a ratio of Rab1A staining in cancer tissues to paired non-cancerous tissue.
Table 1. Rab1A expression in lung cancer and paired noncancerous tissues.
| Tissue type | Cases | Rab1A expression | P value | ||||||||||||||||||||||||||||||||||||||||||||||||||||||||||||||||||||||||||||||||||||||||||||||||
| Positive N (%) | Negative N (%) | ||||||||||||||||||||||||||||||||||||||||||||||||||||||||||||||||||||||||||||||||||||||||||||||||||
| Lung cancer | 60 | 57 (95) | 3 (5) | 0.000 | |||||||||||||||||||||||||||||||||||||||||||||||||||||||||||||||||||||||||||||||||||||||||||||||
| Paired noncancerous | 60 | 3 (5) | 57 (95) | ||||||||||||||||||||||||||||||||||||||||||||||||||||||||||||||||||||||||||||||||||||||||||||||||
| P = 0.000; cancer vs. paired noncancerous determined by Fisher’s exact test | |||||||||||||||||||||||||||||||||||||||||||||||||||||||||||||||||||||||||||||||||||||||||||||||||||
Table 2. Rab1A expression in five pathological subtypes of lung cancer.
| Pathological subtype | Cases | Rab1A expression | P value | ||||||||||||||||||||||||||||||||||||||||||||||||||||||||||||||||||||||||||||||||||||||||||||||||
| Positive N (%) | Negative N (%) | ||||||||||||||||||||||||||||||||||||||||||||||||||||||||||||||||||||||||||||||||||||||||||||||||||
| Adenocarcinoma | 20 | 20 (100) | 0 (0) | ||||||||||||||||||||||||||||||||||||||||||||||||||||||||||||||||||||||||||||||||||||||||||||||||
| Squamous carcinoma | 10 | 9 (90) | 1 (10) | ||||||||||||||||||||||||||||||||||||||||||||||||||||||||||||||||||||||||||||||||||||||||||||||||
| Adenosquamous carcinoma | 10 | 10 (100) | 0 (0) | 0.000 | |||||||||||||||||||||||||||||||||||||||||||||||||||||||||||||||||||||||||||||||||||||||||||||||
| Large cell lung cancer | 10 | 10 (100) | 0 (0) | ||||||||||||||||||||||||||||||||||||||||||||||||||||||||||||||||||||||||||||||||||||||||||||||||
| Small cell lung cancer | 10 | 8 (80) | 2 (20) | ||||||||||||||||||||||||||||||||||||||||||||||||||||||||||||||||||||||||||||||||||||||||||||||||
| All P values = 0.000; cancer vs. paired noncancerous as determined by Fisher’s exact test. | |||||||||||||||||||||||||||||||||||||||||||||||||||||||||||||||||||||||||||||||||||||||||||||||||||
Rab1A is highly expressed in lung cancer cell lines but not correlated with expression of key signaling pathways
We further examined Rab1A expression in a panel of lung cancer cell lines. Compared with the immortalized lung/bronchus epithelial cell line BEAS-2B, Rab1A is highly expressed in all lung cancer cell lines with great variability, ranging from a 6-fold increase in the A549 and H1650 cell lines to a 1.5-fold increase in H460 and SK-LU-1 cells lines (Figure 2A and B). These findings are consistent with Rab1A expression levels in lung cancer tissues. Because Rab1A has been reported to be correlated with hyperactive mTORC1 signaling in human colorectal cancer [8], we examined whether Rab1A expression was correlated with mTORC1 signaling in lung cancer. However, no significant correlation between Rab1A and P-S6K1 (T389) was observed in lung cancer cell line panels. We further examined substrates of other key cancer cell signaling pathways, including P-AKT (S473), P-ERK (T202/Y204), P-C-JUN (S63) and P-MK2 (T334), but no correlation between expression of these proteins and Rab1A expression was observed (Figure 2C-G), indicating that, under physiological conditions, Rab1A expression is not correlated with the basal expression levels of the mTORC1, mTORC2, MEK, JNK and p38MAPK signaling pathways in lung cancer.
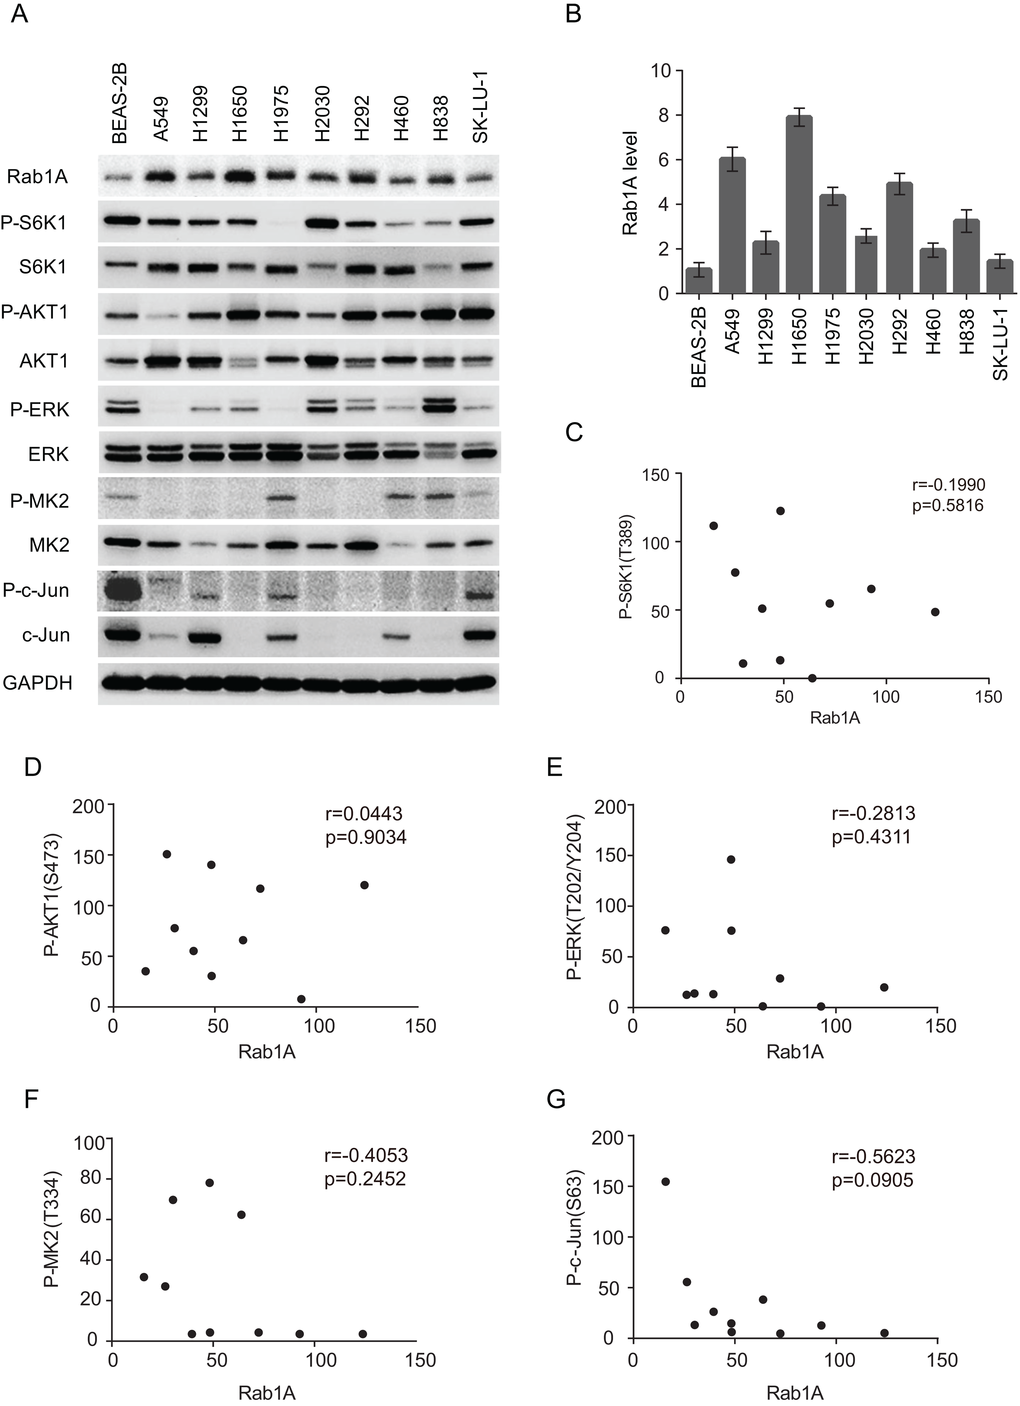
Figure 2. Rab1A is overexpressed in lung cancer cell lines but is not correlated with mTORC or MAPK expression. (A) Expression of Rab1A, P-S6K, S6K, P-AKT, AKT, P-ERK, ERK, P-MK2, MK2, P-c-Jun and c-Jun was examined in a panel of lung cancer cell lines by immunoblot. GAPDH served as a loading control. (B) Quantitative analysis of Rab1A protein levels in cell lines. The densitometry results for each Rab1A band were normalized to GAPDH, and the ratios between cancer cell lines and BEAS-2B were calculated and results represented in a histogram. Data represent means ± SD of three independent experiments. (C-F) Correlation plots of the expression level of Rab1A and P-S6K1 (T389; C), P-AKT (S473; D), P-ERK (T202/Y204; E), P-MK2 (T334; F) and P-c-Jun (S63; G). Shown are arbitrary units.
Rab1A knockdown has no effect on mTOR signaling or lung cancer cell growth
It has been reported that Rab1A knockdown dramatically attenuated mTORC1 signaling and cell growth in CRC and HCC. Therefore, we examined whether Rab1A knockdown had similar effects in human lung cancers. Although Rab1A was successfully knocked down in a panel of lung cancer cell lines, no changes were observed with regards to mTORC1 (P-S6K1(T389)) or mTORC2 (P-AKT (S473)) signaling (Figure 3A). Consistent with these findings, cell growth was not affected by Rab1A knockdown in an MTT assay (Figure 3B).
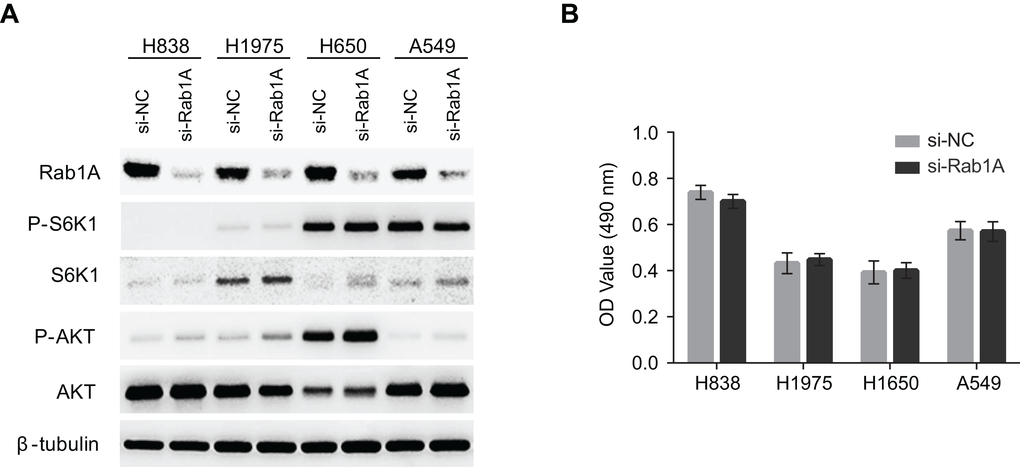
Figure 3. Rab1A does not regulate mTOR signaling or cell growth in lung cancer. (A) The effects of Rab1A knockdown was examined in H838, H1975, H650 and A549 cells by immunoblot. Levels of P-S6K1 (T389), S6K, P-AKT (S473) and AKT are shown. β-tubulin was used as a loading control. (B) Rab1A was knocked down in H838, H1975, H650 and A549 cells. The relative growth of these cells was analyzed using an MTT assay. Data represent means ± SD of three independent triplicate experiments. si-NC, negative control siRNA; si-Rab1A, Rab1A-specific siRNA.
Discussion
Elevated levels of Rab1A DNA, mRNA or protein have been reported previously in human CRC [8], gliomas [14], HCC [18], prostate cancer [15] and tongue squamous carcinomas [16]. Our study for the first time shows that Rab1A is significantly overexpressed in lung cancer. These results indicate that Rab1A overexpression is widespread in human malignancies, consistent with its oncogenic function. In addition, in lung cancer, Rab1A expression levels were not correlated with histological type; different lung cancer subtype tissues and cell lines all showed significant Rab1A overexpression, suggesting that aberrant Rab1A expression is universal in lung cancers. It has been reported that Rab1A overexpression is correlated with disease progression and prognosis in CRC and HCC [8,18]. Here we report that Rab1A overexpression is correlated with tumor volume and stage in lung cancer. This result indicates that Rab1A may contribute to lung cancer progression, and further emphasizes the important role of Rab1A in human malignancies.
Recent studies have shown that Rab1 is a regulator of several central signal transduction pathways, particularly the mTOR pathway [6,21]. Rab1A overexpression is a driver of mTORC1 signaling and mTORC1-dependent growth in CRC by regulating the interaction of mTORC1 with the small GTPase Rheb, which activates mTORC1 activity on the Golgi surface. However, unlike in CRC, Rab1A overexpression is not correlated with basal mTORC1 (P-S6K1) or mTORC2 (P-AKT (S473)) signaling in lung cancer cells, and Rab1A knockdown did not significantly alter mTORC1 or mTORC2 activity. In addition, Rab1A knockdown had no effect on cell growth or the induction of apoptosis (data not shown), which is consistent with a lack of effect on mTORC1 and mTORC2 signaling. These results indicate that, although Rab1A overexpression is a general phenomenon in human malignancies, its function and mechanism of action are highly variable in different cancer types. Rab1A did not regulate mTOR signaling in human lung cancer. It would be of interest to investigate whether Rab1B, a paralog of Rab1A, could play a major role in mTOR regulation in lung cancer.
We also analyzed a panel of lung cancer cell lines for additional key signaling pathways including mitogen-activated protein kinase (MAPK) pathways, which are often deregulated in human cancers [22–24]. Three distinct MAPK cascades, MEK/ERK, JNK/c-Jun and p38/MK2 were investigated, but no significant correlation with Rab1A was observed, indicating that MAPK pathways may not be involved in the mechanisms by which Rab1A contributes to lung cancer.
In light of the present data considered in the context of previous findings, we can hypothesize that Rab1A overexpression is associated with clinical pathological parameters of human lung cancer. Because this study examined limit number of cell lines from different histological subtypes, to achieve a sound conclusion, correlation between major cancer signaling pathways and the malignant role of Rab1A needs to be further evaluated in a larger sample set of cancer tissues/cancer cell lines from specific histological subtype of lung cancer. The mechanisms by which Rab1A overexpression contributes to lung cancer, including cell cycle progressing and promoting migration and metastasis, are under investigation.
Materials and Methods
Tissue array and immunohistochemistry
Sixty de-identified lung cancer tissues with paired adjacent noncancerous tissues were collected from the hospital between January 2007 and March 2008 and developed into tissue arrays by Shanghai OUTDO Biotech (Shanghai, China). Twenty adenocarcinomas, 10 squamous carcinomas, 10 adenosquamous carcinomas, 10 large cell carcinomas and 10 small cell carcinomas were included. The study protocols were approved by the SJTUSM (Shanghai Jiao Tong University School of Medicine) Ethics Committee. All procedures adhere to the BRISQ Guidelines for reporting research on human biospecimens.
Immunohistochemical detection of Rab1A was performed using a streptavidin-biotin complex method as described previously [8]. The primary antibody against Rab1A (Proteintech Group) was used at a concentration of 1:100. To score a tumor cell as positive, cytoplasmic or nuclear staining was performed. For quantitative analysis, a Histo (H) score was calculated based on the staining intensity and percentage of stained cells using Aperio ScanScope systems (Vista, CA, USA). The intensity score was defined as follows: 0, no appreciable staining in cells; 1, weak staining in cells comparable with stromal cells; 2, intermediate staining; 3, strong staining. The fraction of positive cells was scored as 0%-100%. The H score was calculated as previously described, by multiplying the intensity score and the fraction score [8], producing a total range of 0-300. Based on the distribution of the data, a cutoff of 67.5 was used for Rab1A positivity. Tissue sections were examined and scored separately by two independent investigators blinded to the clinicopathologic data.
Cell lines and culture conditions
Immortalized bronchial epithelial cells (BEAS-2B) and nine human lung cancer cell lines (A549, H1299, H1650, H1975, H2030, H292, H460, H838, SK-LU-1) were purchased from ATCC (American type culture collection). All cell lines were confirmed to be free of mycoplasma contamination. BEAS-2B and H292 cells were cultured in Dulbecco’s Modified Eagle Medium with 10% fetal bovine serum (FBS). A549, H1299, H1650, H1975, H2030, H460, H838 and SK-LU-1 cells were cultured in RPMI 1640 medium with 10% FBS. All cell lines were maintained at 37°С in a 5% CO2 incubator. Cell lines were immediately expanded upon receipt and aliquots frozen to allow the cell lines to be restarted every three to four months from the same batch of cells. Cell phenotypes were verified in every experiment.
siRNA transfection
Small interfering RNAs (siRNAs) targeting human Rab1A was synthesized by GenePharma (Shanghai, China) and have been validated in our previous studies [8]. Sequences: Rab1A siRNA, AAU AAC UGG AGG UGA UUG UUC, Negative control siRNA: UUC UCC GAA CGU GUC ACG UTT. Transfections were performed on a panel of lung cancer cell lines. Cells were incubated with siRNA oligonucleotides and Lipofectamine 3000 (ThermoFisher, Pittsburgh, PA) transfection reagent for 12 h. The cell culture medium was then replenished with fresh culture medium and the cells were analyzed.
MTT assay
To determine the effects of Rab1A knockdown, cell growth was analyzed using an MTT assay as previously described [20]. Cells were harvested 12 h post-transfection and re-seeded in 96-well plates at an initial density of 3 × 10³ cells/well. Assays were performed at 48 h post-seeding according to the manufacturer’s protocols. Data represent the mean ± SD (absorbance value at 490 nm) from three independent triplicate experiments.
Antibodies and immunoblotting
Cells were harvested 48 h post-transfection and subjected to immunoblotting as described previously [8]. Reagents were obtained from the following sources: antibody for Rab1A, Proteintech Group (Rosemont, IL); antibodies for P-S6K1(T398), S6K1, P-AKT(S473), AKT, P-ERK(T202/Y204), ERK, P-MK2(T334), MK2 and Tubulin, Cell Signaling Technology (Danvers, MA). HRP-labeled GAPDH, anti-mouse and anti-rabbit antibodies were purchased from Santa-Cruz Biotechnology (Dallas, Texas). The EDTA-free Complete Protease Inhibitor Cocktail and PhosSTOP were obtained from Roche (Basel, Switzerland). All primary antibodies were confirmed to be reactive only to the targets by the manufacturer and used at 1:1000, and secondary antibodies were used at 1:10000. The data represent at least three independent experiments.
Statistical analysis
Statistical analyses were carried out using SPSS 20.0 software. The statistical analysis of numeration data was performed using Pearson’s chi-square test or Fisher’s exact chi-square test. The comparisons of continuous data between groups were performed using the Kruskal-Wallis test. A nonparametric Spearman’s correlation test was performed to analyze the correlation between Rab1A and P-S6K1, P-AKT1, P-ERK, P-MK2 and P-c-Jun expression levels. All statistical tests were conducted at a two-sided significance level of 0.05.
Conflicts of Interest
The authors declare that they have no competing interests.
Funding
This work was partially supported by grants from the National Natural Science Foundation of China (81572796 to F.L and 81672354 to Y.Z), Shanghai Pujiang Program (15PJ1404900 to Y.Z) and Foundation of Shanghai Jiao Tong University School of Medicine (14XJ10036 to F.L).
References
- 1. Weller A, O’Brien ME, Ahmed M, Popat S, Bhosle J, McDonald F, Yap TA, Du Y, Vlahos I, deSouza NM. Mechanism and non-mechanism based imaging biomarkers for assessing biological response to treatment in non-small cell lung cancer. Eur J Cancer. 2016; 59:65–78. https://doi.org/10.1016/j.ejca.2016.02.017 [PubMed]
- 2. Ferlay J, Soerjomataram I, Dikshit R, Eser S, Mathers C, Rebelo M, Parkin DM, Forman D, Bray F. Cancer incidence and mortality worldwide: sources, methods and major patterns in GLOBOCAN 2012. Int J Cancer. 2015; 136:E359–86. https://doi.org/10.1002/ijc.29210 [PubMed]
- 3. Torre LA, Bray F, Siegel RL, Ferlay J, Lortet-Tieulent J, Jemal A. Global cancer statistics, 2012. CA Cancer J Clin. 2015; 65:87–108. https://doi.org/10.3322/caac.21262 [PubMed]
- 4. John LD. Self-care strategies used by patients with lung cancer to promote quality of life. Oncol Nurs Forum. 2010; 37:339–47. https://doi.org/10.1188/10.ONF.339-347 [PubMed]
- 5. Hutagalung AH, Novick PJ. Role of Rab GTPases in membrane traffic and cell physiology. Physiol Rev. 2011; 91:119–49. https://doi.org/10.1152/physrev.00059.2009 [PubMed]
- 6. Li Y, Wang HY, Zheng XF. Rab1 GTPases as oncogenes. Aging (Albany NY). 2015; 7:897–98. https://doi.org/10.18632/aging.100849 [PubMed]
- 7. Touchot N, Zahraoui A, Vielh E, Tavitian A. Biochemical properties of the YPT-related rab1B protein. Comparison with rab1A. FEBS Lett. 1989; 256:79–84. https://doi.org/10.1016/0014-5793(89)81722-3 [PubMed]
- 8. Thomas JD, Zhang YJ, Wei YH, Cho JH, Morris LE, Wang HY, Zheng XF. Rab1A is an mTORC1 activator and a colorectal oncogene. Cancer Cell. 2014; 26:754–69. https://doi.org/10.1016/j.ccell.2014.09.008 [PubMed]
- 9. Charng WL, Yamamoto S, Jaiswal M, Bayat V, Xiong B, Zhang K, Sandoval H, David G, Gibbs S, Lu HC, Chen K, Giagtzoglou N, Bellen HJ. Drosophila Tempura, a novel protein prenyltransferase α subunit, regulates notch signaling via Rab1 and Rab11. PLoS Biol. 2014; 12:e1001777. https://doi.org/10.1371/journal.pbio.1001777 [PubMed]
- 10. Wang C, Yoo Y, Fan H, Kim E, Guan KL, Guan JL. Regulation of Integrin β 1 recycling to lipid rafts by Rab1a to promote cell migration. J Biol Chem. 2010; 285:29398–405. https://doi.org/10.1074/jbc.M110.141440 [PubMed]
- 11. Zoppino FC, Militello RD, Slavin I, Alvarez C, Colombo MI. Autophagosome formation depends on the small GTPase Rab1 and functional ER exit sites. Traffic. 2010; 11:1246–61. https://doi.org/10.1111/j.1600-0854.2010.01086.x [PubMed]
- 12. Wu G, Yussman MG, Barrett TJ, Hahn HS, Osinska H, Hilliard GM, Wang X, Toyokawa T, Yatani A, Lynch RA, Robbins J, Dorn GW
2nd . Increased myocardial Rab GTPase expression: a consequence and cause of cardiomyopathy. Circ Res. 2001; 89:1130–37. https://doi.org/10.1161/hh2401.100427 [PubMed] - 13. Coune PG, Bensadoun JC, Aebischer P, Schneider BL. Rab1A over-expression prevents Golgi apparatus fragmentation and partially corrects motor deficits in an alpha-synuclein based rat model of Parkinson’s disease. J Parkinsons Dis. 2011; 1:373–87. [PubMed]
- 14. Bao ZS, Li MY, Wang JY, Zhang CB, Wang HJ, Yan W, Liu YW, Zhang W, Chen L, Jiang T. Prognostic value of a nine-gene signature in glioma patients based on mRNA expression profiling. CNS Neurosci Ther. 2014; 20:112–18. https://doi.org/10.1111/cns.12171 [PubMed]
- 15. Abd Elmageed ZY, Yang Y, Thomas R, Ranjan M, Mondal D, Moroz K, Fang Z, Rezk BM, Moparty K, Sikka SC, Sartor O, Abdel-Mageed AB. Neoplastic reprogramming of patient-derived adipose stem cells by prostate cancer cell-associated exosomes. Stem Cells. 2014; 32:983–97. https://doi.org/10.1002/stem.1619 [PubMed]
- 16. Shimada K, Uzawa K, Kato M, Endo Y, Shiiba M, Bukawa H, Yokoe H, Seki N, Tanzawa H. Aberrant expression of RAB1A in human tongue cancer. Br J Cancer. 2005; 92:1915–21. https://doi.org/10.1038/sj.bjc.6602594 [PubMed]
- 17. Sun T, Wang X, He HH, Sweeney CJ, Liu SX, Brown M, Balk S, Lee GS, Kantoff PW. MiR-221 promotes the development of androgen independence in prostate cancer cells via downregulation of HECTD2 and RAB1A. Oncogene. 2014; 33:2790–800. https://doi.org/10.1038/onc.2013.230 [PubMed]
- 18. Xu BH, Li XX, Yang Y, Zhang MY, Rao HL, Wang HY, Zheng XF. Aberrant amino acid signaling promotes growth and metastasis of hepatocellular carcinomas through Rab1A-dependent activation of mTORC1 by Rab1A. Oncotarget. 2015; 6:20813–28. https://doi.org/10.18632/oncotarget.5175 [PubMed]
- 19. Nikoshkov A, Broliden K, Attarha S, Sviatoha V, Hellström AC, Mints M, Andersson S. Expression pattern of the PRDX2, RAB1A, RAB1B, RAB5A and RAB25 genes in normal and cancer cervical tissues. Int J Oncol. 2015; 46:107–12. [PubMed]
- 20. Qin X, Wang X, Liu F, Morris LE, Wang X, Jiang B, Zhang Y. Gankyrin activates mTORC1 signaling by accelerating TSC2 degradation in colorectal cancer. Cancer Lett. 2016; 376:83–94. https://doi.org/10.1016/j.canlet.2016.03.013 [PubMed]
- 21. Sanchez-Gurmaches J, Guertin DA. mTORC1 gRABs the Golgi. Cancer Cell. 2014; 26:601–03. https://doi.org/10.1016/j.ccell.2014.10.011 [PubMed]
- 22. Wicki A, Mandalà M, Massi D, Taverna D, Tang H, Hemmings BA, Xue G. Acquired resistance to clinical cancer therapy: a twist in physiological signaling. Physiol Rev. 2016; 96:805–29. https://doi.org/10.1152/physrev.00024.2015 [PubMed]
- 23. Dhillon AS, Hagan S, Rath O, Kolch W. MAP kinase signalling pathways in cancer. Oncogene. 2007; 26:3279–90. https://doi.org/10.1038/sj.onc.1210421 [PubMed]
- 24. Kim EK, Choi EJ. Pathological roles of MAPK signaling pathways in human diseases. Biochim Biophys Acta. 2010; 1802:396–405. https://doi.org/10.1016/j.bbadis.2009.12.009 [PubMed]