


Introduction
Acute myeloid leukemia (AML) and acute lymphoblastic leukemia (ALL) are heterogenous diseases of hematopoietic stem cells and progenitor cells. AML is a cancer of the myeloid line of blood cells, characterized by the rapid growth of abnormal white blood cells that accumulate in the bone marrow and interfere with the production of normal blood cells [1]. AML involves high percentages of dedifferentiated and undifferentiated cells, including blasts (myeloblasts, monoblasts and megakaryoblasts) [2]. AML is relatively rare in the childhood, but it is the most common acute leukemia affecting adults, and its incidence increases with age [3]. As an acute leukemia, AML progresses rapidly and is typically fatal within weeks or months if left untreated. AML is cured in 35–40% of people under 60 and in 5–15% of patients over 60 respectively [2].
Unlike AML, acute lymphoblastic leukemia (ALL) is most common in childhood, with a peak incidence at 1–6 years of age [4,5]. AML is characterized by the overproduction and accumulation in bone marrow of immature cancerous white blood cells, referred to as lymphoblasts [6]. Over 80% of the affected children are cured, while only 20-40% of the adults achieve complete remission [4,7]. Multiple molecular peculiarities, such as diagnostic mutations and certain gene expression signatures, have been associated with AML and ALL in previous studies [8–11].
However, the genetic or gene expression factors responsible for the age-related manifestation features of AML and ALL remain uncertain. To date, gene expression analysis has been performed on a very limited number of AML/ALL cancer samples, especially for the pediatric onset. This may be due to relative rarity of AML/ALL and very limited access to pediatric cancer patient biopsies [12]. On the other hand, it is difficult to compare gene expression data obtained in different experiments and using different experimental platforms, primarily because of well-known batch effect, which reflects experimental bias [13].
In this study, we used microarray hybridization to compare the gene expression in the two groups of human pediatric AML and ALL biosamples. We compared pediatric onset-specific AML gene expression profiles with those characteristic of adult AML. To analyze the expression data, we used molecular pathway approach which was shown to reduce platform-specific bias in various assays [14]. We identified 36 and 172 characteristic pathway and gene expression signatures, respectively, clearly distinguishing ALL, AML and normal cases. We compared the results for pediatric AML with the adult AML and normal blood samples to identify molecular features common and specific for the pediatric and adult disease onset. As the result, we found 7/2 age-independent AML gene expression/molecular pathway signatures and 132/33 those linked with the age-specific AML onset, respectively. These findings shed light on the molecular mechanisms governing age-specific onset of human leukemia and identify novel potential targets for the molecular therapy of ALL and AML.
Results
Profiling of gene expression in leukemia samples
The bone marrow biopsy samples were collected and analyzed for seven pediatric acute lymphoblast leukemia (ALL) and seven pediatric acute myeloid leukemia (AML) samples. The mean ages were 7 and 6 years old (y.o.) for the patients in the AML and ALL groups, respectively. Leukemia samples were compared with the normal peripheral blood isolated from the three healthy donors, with the mean age in the group 12 y.o. (Supplementary dataset S1).
The total RNA preps were extracted, and gene expression was profiled with microarray hybridization. We used original customized microchip system developed using the CustomArray (USA) technology of direct electrochemical oligonucleotide synthesis on the array [15]. Using the CustomArray platform, we synthesized the arrays with 2228 oligonucleotide probes corresponding to 2016 human genes involved in 334 intracellular signaling pathways (Supplementary dataset S2). For the custom microchip, we used original oligonucleotide probe sequences of the Illumina HT 12 v4 platform. The library preparation and hybridization protocol is outlined on Supplementary dataset S3. The microarray hybridization signals were quantile normalized according to Bolstad et al. [16], and gene expression data were deposited in GEO database with the accession numbers GSE84574 and GSE84575.
For the adult leukemia samples, we took GEO dataset GSE37307containing 30 AML and 17 peripheral blood samples profiled using the Affymetrix hgu133a microarray hybridization platform. The gene expression data were quantile normalized and further compared with pediatric samples.
Bioinformatic analysis of gene expression data
We processed the transcriptomic data under investigation to establish normalized cancer-to-normal (CNR) expression rates and to build pathway activation strength (PAS) profiles corresponding to intracellular signaling pathways for each sample. The analysis included 334 pathways (Supplementary dataset S2) and 2016 individual gene products. For PAS measurements, we applied the OncoFinder method which was previously shown to increase the stability of gene expression data [14]. In multiple previous studies, OncoFinder was utilized to analyze human and non-human samples from a broad range of conditions including leukemia, solid cancers, fibrosis, age-related macular degeneration disease, asthma, Hutchinson-Gilford disease and cell culture [17–20]. The formula for PAS calculation for a given pathway (p) is as follows [21]:
The functional role of a gene product in a pathway is reflected here by a discrete flag activator/repressor role (ARR), which equals 1 for an activator, –1 for a repressor, and shows intermediate values -0,5; 0,5 and 0 for the gene products having intermediate repressor, activator, or unknown roles, respectively. The CNRn value is the ratio of the expression level of a gene n in the sample under investigation to the average expression level in the control sampling. N is the number of individual gene products in the pathway p. The positive value of PAS indicates activation of a pathway, and the negative value - its repression in a biosample under investigation. The CNR and PAS values obtained for the normal and leukemia samples are shown on Supplementary dataset S2.
Comparison of pediatric and adult normal and leukemia gene expression profiles
The CNR and PAS data were analyzed in two ways to identify gene expression and PAS signatures that distinguish (i) pediatric ALL and AML from normal samples and (ii) pediatric AML from the adult AML samples.
Pediatric ALL-specific features
We compared seven pediatric ALL samples with the three normal peripheral blood samples. To identify the characteristic ALL-specific features, we calculated the “area-under-curve” (AUC) values [22] for the CNR and PAS scores of each of the gene products and pathways under investigation. The AUC value is the universal characteristics of biomarker robustness and it is dependent on the sensitivity and specificity of a biomarker. It correlates positively with the biomarker quality and may vary in an interval from 0.5 till 1. The AUC threshold for discriminating good and bad biomarkers is typically 0.7 or 0.75. The entries having greater AUC score are considered good-quality biomarkers and vice-versa [23]. We could identify 94 gene products and 47 molecular pathways that had close to 1 AUC scores for the ALL-normal comparison (Supplementary dataset S4, Table 1). Among those, branches of Akt signaling [24], cAMP [25], cytoplasmic and mitochondrial apoptosis [26], PTEN [27], ATM checkpoint [28], Hedgehog [29], HGF [30], GSK3 [31], Estrogen and Glucocorticoid reception [32,33], IGF1R [34], IL2 [35], TNF [36], ILK [37], JAK-STAT [38], JNK [39], mTOR [40], TGF-beta [41], Ras [42], PPAR [43], NGF [44], VEGF [45], Wnt [46], HIF1 and Notch signaling [47] were previously reported in the literature as ALL-associated pathways. However, the identified GPCR and TRAF-associated apoptosis marker pathways were new, thus representing ~4% of the total ALL-specific pathways.
Table 1. Statistics of the gene expression and pathway activation markers identified in this study.
| Comparison | Gene expression markers (GEM) | AUC (GEM) | Pathway activation markers (PAM) | AUC (PAM) |
| Pediatric ALL vs Normal | 94 | ~1 | 47 | 0.90-1 |
| Pediatric AML vs Normal | 148 | ~1 | 31 | 0.95-1 |
| Pediatric AML vs Pediatric ALL | 139 | 0.91-1 | 34 | 0.92-1 |
| Pediatric AML vs Pediatric ALL vs Normal | 172 | 0.85-0.98 | 36 | 0.84-0.96 |
| Adult AML vs Normal | 132 | 0.75-0.95 | 33 | 0.75-0.86 |
Pediatric AML-specific features
When comparing the seven pediatric AML and three normal peripheral blood transcriptomes, we identified 148 marker gene products and 31 molecular pathways with close to 1 AUC scores (Supplementary dataset S5, Table 1). Among them, one top marker pathway (~3%) has not been previously linked with AML: a branch of Inositol-3-phosphate signaling pathway responsible for gene expression with the transcriptional factors CREB3, NFATC2 and MEF2D was found to be strongly upregulated in the AML samples in this study. Of note, AML cells also demonstrated several upregulated p53-related apoptosis-promoting pathways: the branch of Mitochondrial apoptosis pathway related to the activation of p53-dependent gene expression, the branch of P53 signaling pathway responsible for promotion of apoptosis, and the branch of TNF signaling pathway responsible for apoptosis. However, this enhanced upstream regulation of apoptosis was blocked by the strongly suppressed downstream branch of Mitochondrial apoptosis pathway responsible for the irreversible mechanisms such as the DNA fragmentation (Supplementary dataset S5). A similar figure was seen for the ALL cells, were the activation of the upstream cytoplasmic pathway was compensated by the inhibition of the downstream mitochondrial apoptosis pathway (Supplementary dataset S4). This phenomenon most likely refers to the overall ability of leukemic cells to block programmed cell death at the downstream stages.
AML, ALL and normal peripheral blood-specific features
We next identified CNR and PAS biomarker features that can discriminate between the three classes of pediatric biosamples under investigation: AML, ALL and normal peripheral blood cells, with high AUC scores (Supplementary dataset S6, Table 1). We found 172 such gene products and 36 molecular pathways. Among them, GPCR, CREB pathways and a branch of ATM pathway implicated in cell survival mechanisms, were suppressed in the ALL but upregulated in the AML cells.
Comparison of pediatric AML versus ALL samples
To identify the differential molecular features in the AML and ALL samples, we compared seven ALL versus seven AML gene expression profiles. At the level of gene expression, we found 139 biomarkers with high AUC scores (Supplementary dataset S7, Table 1). Remarkably, this list was enriched by the genes related to proteasome target protein degradation (19/139 genes; Fig.1). All of them were expressed at the high levels in the ALL, and at the significantly lower levels in the AML cells, as this was the case for all eleven ubiquitin-specific peptidase (USP) genes from the list, four ubiquitin protein ligase genes (UBR5, UBE2T, UBE2Q1, UBE2L3), and four genes for proteasome subunit A (PSMA). There were also five genes for tubulins and associated proteins that were all significantly upregulated in the ALL compared to AML. The same trend was observed for the four tumor necrosis factor (TNF) superfamily genes and their receptors (TNFSF9, TNFSF13B, TNFRSF10, TNFRSF11).
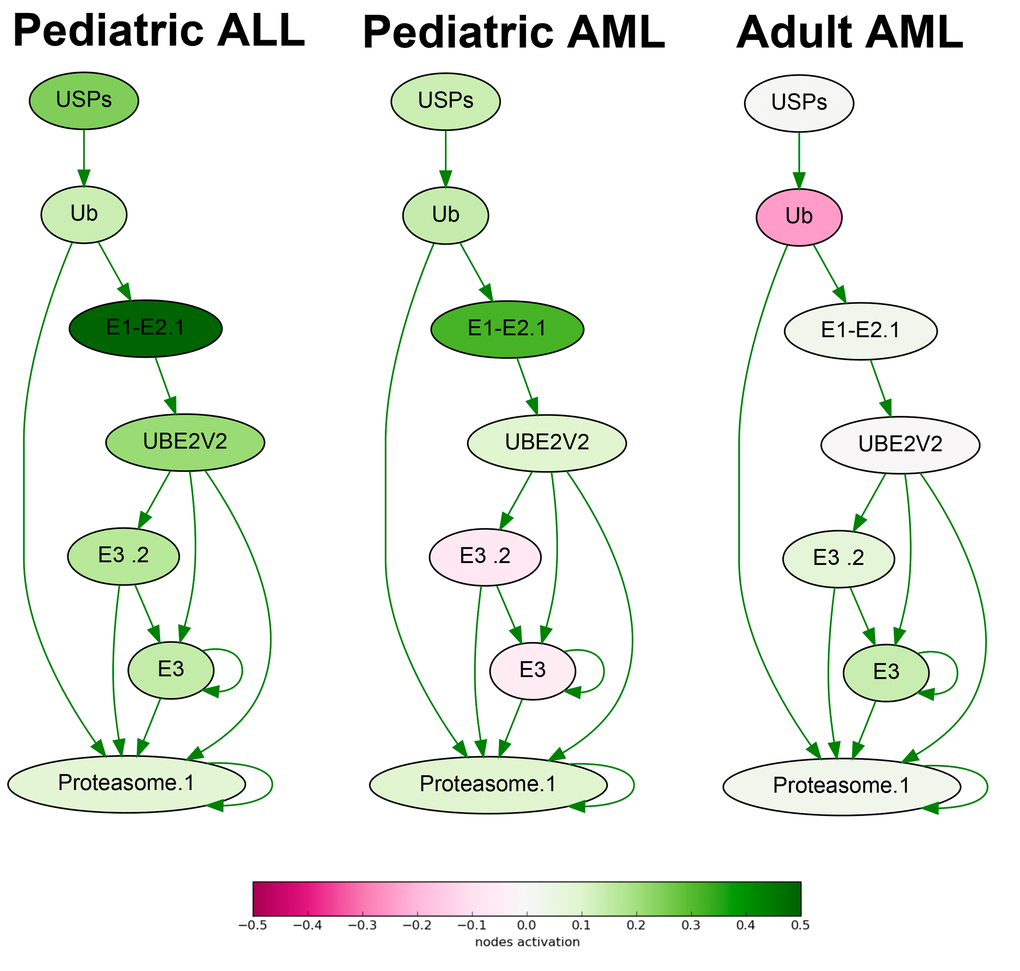
Figure 1. Ubiquitin-dependent proteasome protein degradation pathway shown as an interacting network. Pathway activation features are shown for the averaged pediatric ALL, pediatric AML and adult AML transcriptomes. Up-regulated nodes are shown in green, down-regulated - in purple, color legend is provided at the bottom. Saturation of the color is proportional to logarithm of cancer-to-normal (CNR) expression rate for each node of the pathway.
In contrast, all five genes from the list for G protein subunits (GNA, GNB and GNG family genes), five genes for fibroblast growth factor (FGF) proteins and three glutamate metabotropic receptor (GRM) genes were upregulated in the AML versus ALL samples.
At the molecular pathway level, we identified 34 top features (Supplementary dataset S7, Table 1), including TNF signaling pathway, Ubiquitin-proteasome pathway (Fig.1), branches of ATM, cAMP, Estrogen, GPCR, HIF-1 alpha, ILK, IP3, MAPK, WNT, and other signaling pathways.
For the first time, our data clearly suggest, that the ALL cells are highly enriched in the proteasomal activities compared to the AML cells. In turn, the AML cells are enriched in GPCR (G protein-coupled receptor) signaling. Those molecular differences clearly seen at both levels of (i) individual gene products and (ii) molecular pathways, may help to decode the mechanisms for greater curability of the ALL tumors and provide avenues for finding new molecular targets for treating AML in the future. In addition, these data suggest that using of proteasomal inhibitors like Bortezomib may be beneficial also for the treatment of the pediatric patients with the ALL, not only for the AML patients, as this is the case now in several clinical studies [e.g., [48]].
Comparison of the adult and pediatric AML-specific features
We next compared 30 and 17 transcriptomes obtained for the adult AML and for the adult normal peripheral blood samples. At the gene expression level, we identified 132 top ranking biomarkers, and 33 – at the pathway level (Supplementary dataset S8, Table 1). These molecular pathways were known to be AML-related and included branches of the AHR, ATM, cAMP, FLT3, HGF, ILK, JAK-STAT, Ras, WNT and other signaling pathways.
In contrast to the pediatric AML samples, where several pathways promoting apoptosis were activated, but blocked at the downstream stages (Supplementary dataset S5), in the adult AML cells the only top pathway related to apoptosis (mitochondrial apoptosis pathway) was repressed instead (Supplementary dataset S8). For the top marker genes, we found seven coincidences for both AML types (Table 2), which were all, to our knowledge, not known to be associated with the AML before: CAMK2B for Calcium/calmodulin-dependent protein kinase type II beta chain, EIF4B for translation initiation factor 4B, HAPLN1 for hyaluronan and proteoglycan link protein 1, HIST1H3B for histone cluster 1, H3b, LIPE for hormone sensitive Lipase E, MAPK13 for mitogen-activated protein kinase 13, and SAR1B for secretion-associated Ras-related GTPase 1B.
Table 2. Statistics of the commonly and oppositely regulated gene expression and pathway activation markers in the pediatric and in the adult AML.
| Matches | Gene expression markers | Pathway activation markers |
| Complete matches - concordant | (7) CAMK2B, EIF4B, HAPLN1, HIST1H3B, LIPE, MAPK13, SAR1B | (2) CD40 pathway (cell survival), Ras pathway (CDC42 signaling) |
| Complete matches - discordant | (4) BID, F2, JAK3, PPARA | (1) ATM Pathway (Cell Cycle Checkpoint Control) |
| Incomplete matches – concordant | Not applicable | (14) EGF Pathway (Cell Survival), EGF Pathway (IP3 Signaling), EGF Pathway (Rab5 Regulation Pathway), Glucocorticoid Receptor Pathway (Cell Cycle Progression), Glucocorticoid Receptor Signaling Pathway (Gene Expression via CREB3, STAT5B, SLC22A2, POU2F1), JAK-STAT Pathway, JAK-STAT Pathway (Nml, SOCS, BCL-XL p21, Myc, Nos2, Gene Expression via STAT2), JAK-STAT Pathway (Gene Expression via MYC), Mitochondrial Apoptosis Pathway (DNA Fragmentation), Mitochondrial Apoptosis Pathway (Apoptosis), Ras Pathway (Receptor Endocytosis), Ras Pathway (Increased T-cell Adhesion), TGF-Beta Pathway, TGF-Beta Pathway (Transciption, Arrested Growth, Apoptosis) |
| Incomplete matches - discordant | Not applicable | (17) ATM Pathway, ATM Pathway (S-phase progression), ATM Pathway (Apoptosis), ATM Pathway (Apoptosis and Senescence), ATM Pathway (Checkpoint Activation), ATM Pathway (G2-Mitosis progression), ILK Pathway (Cell Adhesion), ILK Pathway (Opsonization), ILK Pathway (Cell Cycle, Proliferation), ILK Pathway (Cell Migration, Retraction), Mitochondrial Apoptosis Pathway (Gene Expression via TP53), NGF Pathway (Actin Polymerization, Neurite Outgrowth and Differentiation), NGF Pathway (Neurite Outgrowth and Differentiation), PPAR Pathway, PPAR Pathway (Adipocyte Differentiation, Glucose Homeostasis and Macrophage Function), VEGF Pathway, VEGF Pathway (Actin Reorganization). |
Overall, the top expression biomarkers for the pediatric and adult AML were not highly overlapping, thus producing only two completely matching commonly regulated top pathways: a branch of the CD40 pathway influencing cell survival, and a branch of the Ras pathway affecting CDC42 pathway, which were commonly downregulated and upregulated, respectively, in both types of AML. Both pathways have been previously reported to be associated with the AML [49,50]. In addition, different branches of the EGF, Glucocorticoid receptor, JAK-STAT, Mitochondrial apoptosis, Ras and TGF beta pathways were also regulated congruently.
However, the branches of the ATM pathway, ILK signaling, NGF, PPAR and VEGF pathways were regulated oppositely in the adult and pediatric leukemia samples (Table 2). These data evidence that the pediatric and adult AML cells differ greatly in gene expression and in molecular mechanisms used to suppress apoptosis and cell cycle arrest, and to promote growth and proliferation.
Discussion
Acute myeloid leukemia (AML) and acute lymphoblast leukemia (ALL) differ greatly in their behavior, mortality and curability. While ALL occurs primarily in the childhood, the incidence of AML increases with age. The factors that act in an age-dependent manner to promote AML are poorly understood. Although it is widely accepted that the cellular physiology, epigenetic regulation and gene expression of normal hematopoietic stem cells change with age, molecular grounds of such age-dependent cancer transformation remain largely unknown [1]. In the recent review, Karen Keeshan from the University of Glasgow and coauthors said: “Treatment is in general extrapolated from adult AML on the assumption that adult AML and pediatric AML are similar biological entities. However, distinct biological processes and epigenetic modifications in pediatric and adult AML may mean that response to novel therapies in children may differ from that in adults with AML. A better understanding of the key pathways involved in transformation and how these differ between childhood and adult AML is an important step in identifying effective treatment” [1].
In this study, we tried to quantize the distinctions and similarities in pediatric and adult AML at the level of gene expression and molecular pathways. Among the top AML-specific pathways for the groups of adult and pediatric cancers, we identified only three (~9%) completely matching molecular pathways, of which two were commonly regulated (a branch of the CD40 pathway, and a branch of the Ras pathway), and one (a branch of the ATM Pathway governing control over the cell cycle checkpoints) was regulated oppositely, being upregulated in children and downregulated in the adults (Table 2). When considering regulation of the different branches of the same large molecular pathways, we found that there are 14 commonly and 17 oppositely regulated pathways (Table 2). Taken together, these results suggest that the molecular landscapes of the pediatric and the adult AML are very diverse, thus fully confirming the above hypothesis. Our results also open avenue for further in-depth studies decoding functions and roles of the molecular processes identified here in the progression of leukemia and in its age-specific aspects.
In this study, we compared the original experimental and the previously published gene expression data obtained using the custom and the Affymetrix microarray platforms. It is well known that the raw data obtained using different experimental platforms may be poorly compatible with each other [14]. In the future, the adult and the pediatric leukemia samples may be compared using the same experimental platform. However, recently we showed that aggregation of gene expression data into molecular pathways may help to solve the problem of poor data compatibility. For example, deep sequencing and microarray data obtained for the same RNA samples showed generally low correlation (<0.2) when examined at the level of individual genes. However, these correlations improved dramatically, up to 0.9, when activation of molecular pathways was analyzed instead [14]. Here, we compared the experimental and the literature datasets at both the individual gene expression and at the pathway activation levels. We may expect that this granted somewhat greater stability to the results obtained for the comparison of the pediatric and the adult leukemia cells at the level of molecular pathways.
In this study, we identified multiple gene expression and pathway activation markers specific for the AML (Table 1), among them seven genes (CAMK2B, EIF4B, HAPLN1, HIST1H3B, LIPE, MAPK13, SAR1B) and one pathway (branch of Inositol-3-phosphate signaling pathway responsible for gene expression with the transcriptional factors CREB3, NFATC2 and MEF2D), for which association with the AML was previously unknown.
For the pediatric acute lymphoblast leukemia (ALL), we found 97 gene expression markers and 47 characteristic molecular pathways, of which two (GPCR and TRAF-associated apoptosis marker pathways) were also new (Table 1). When comparing the pediatric AML and ALL transcriptomes, we identified 139/34 gene expression/pathway biomarkers (Table 1). These results suggest, that the ALL cells are highly enriched in the proteasomal target protein degradation activities compared to the AML cells. In turn, the AML cells are enriched in GPCR (G protein-coupled receptor) signaling. In addition, we found 172 / 36 gene expression/pathway biomarkers that may be used to distinguish between the normal peripheral blood, AML and ALL cells with the high AUC scores (Table 1).
Finally, we generated the high-throughput gene expression profiles for the extremely rare biosamples of human pediatric leukemia biosamples and normal blood, obtained in a single experiment, thus increasing quality of gene expression data. These experiments may contribute to the understanding of molecular grounds that are responsible for the overall phenotypic differences between the pediatric AML and ALL cells, and for their clinical responses.
Materials and Methods
Tissue specimens and RNA isolation
Three normal peripheral blood specimens from healthy donors, seven AML and seven ALL specimens obtained from patients treated in 2015-16 at the D. Rogachev Center of Pediatric Hematology, Oncology and Immunology (CPHOI), Moscow, Russia, were analyzed. All patients provided written informed consent to participate in this study. This study was approved by the local ethical committee at the CPHOI. The mean age of the ALL patients at the time of sampling was 5.7 years (range 1–14 years), and 7 years for the AML patients (range 1-15 years). The mean age for the healthy donors of peripheral blood at the time of sampling was 11.7 years (range 10–13 years). Both the tumors and normal tissues were evaluated by a pathologist to confirm the diagnosis and estimate the tumor cell numbers. All tumor samples used in this study contained at least 90% tumor cells. Mononuclear cells were extracted shortly after bone marrow or peripheral blood samples collection. Cells were obtained by a density gradient centrifugation method using DiacollTM (Ficoll-1077) (Dia-M, Russia). 2-3 ml of bone marrow or blood was dissolved in PBS up to 10 ml. Cell suspension was layered on 2.5 ml of Diacoll in 15 ml centrifuge tube and centrifuged at 400 RCF for 40 min. Buffy coat was removed and dissolved in PBS up to 14 ml followed by centrifugation at 800 RCF for 10 min. PBS wash procedure was performed twice. Pellet was dissolved in 0,5-1 ml of RNALater solution (Thermo Fisher Scientific). Cells were counted by Scepter™ 2.0 Handheld Automated Cell Counter (Merck Millipore), aliquoted and stored at -20°C till RNA extraction and microarray hybridization. For RNA extraction, cell suspensions with RNALater were centrifuged at 3000 RCF for 5 min. Pellets were dissolved in TRI Reagent (MRC), Direct-zol™ RNA MiniPrep (Zymo Research) was used for RNA extraction. RNA was quantified using Nanodrop (Thermo Fisher Scientific).For the adult leukemia samples, we took GEO dataset GSE37307 containing 30 AML and 17 peripheral blood samples profiled using the Affymetrix HG-U133a microarray hybridization platform.
Synthesis of microarrays
B3 microarray synthesizer (CustomArray, USA) was used for forty nucleotides-long oligonucleotide probe synthesis on CustomArray ECD 4X2K/12K slides. Synthesis was performed according to the manufacturer’s recommendations. Four replicates of total 2228 unique oligonucleotide probes specific to 2016 human gene transcripts were placed on each chip. Chip design was performed using Layout Designer software (CustomArray, USA).
Library preparation and hybridization
Complete Whole Transcriptome Amplification WTA2 Kit (Sigma) was used for reverse transcription and library amplification. Manufacturers protocol was modified by adding to amplification reaction dNTP mix containing biotinylated dUTP, resulting to final proportion dTTP/biotin-dUTP as 5/1. Microarray hybridization was performed according to the CustomArray ElectraSense™ Hybridization and Detection protocol. Hybridization mix contained 2.5 ug of labeleled DNA library, 6X SSPE, 0.05% Tween-20, 20mM EDTA, 5x Denhardt solution, 100 ng/ul sonicated calf thymus gDNA, 0,05% SDS. Hybridization mix was incubated with chip overnight at 50ºC. Hybridization efficiency was detected electrochemically using CustomArray ElectraSense™ Detection Kit and ElectraSense™ 4X2K/12K Reader.
Low-level processing of microarray data
Probe signals were geometrically averaged, thus obtaining expression value for each specific type of the probe. The whole dataset was next rounded down to integer values and normalized using the “DeSeq2” package’s “estimateSizeFactors” function with respect to the sample type (Normal blood, AML or ALL). The same geometrical averaging was performed for the GSE37307 dataset (excluding the normal testis samples) using the correspondence table from the “hgu133a” Bioconductor package. Then quantile normalization [16] was performed using the “preprocessCore” package, and 2016 genes corresponding to the experimental custom array design were selected for further analysis. Gene expression data were deposited in Gene Expression Omnibus database with the accession numbers GSE84574 and GSE84575.
Functional annotation of gene expression
The SABiosciences signaling pathways knowledge base (http://www.sabiosciences.com/pathwaycentral.php) was used to determine structures of intracellular pathways, as described previously [51]. We applied OncoFinder original algorithm [21] for functional annotation of the primary expression data and for calculating pathway activation strength (PAS) scores and cancer-to-normal ratios (CNRs). CNRn is the ratio of the expression levels of a gene n in the sample under investigation to the average expression in the control group of samples. In this study, we used normalized PAS scores (PAS2), where each initial PAS score obtained according to [21] was divided by the number of genes in the corresponding pathway in order to normalize the activation values and balance heatmap color schemes. Results for the 334 pathways were obtained for each sample. Statistical tests were determined using the R software package.
Statistical analysis
Hierarchical clustering heatmaps with Euclidean distance and complete-linkage were generated using heatmap.2 function from "gplots" package [52]. Pathways which returned the same PAS scores for all the samples were removed from the analyses. AUC (area under curve) values were calculated using the ‘caTools’ package and cutoff value in each of the comparisons was set to leave approximately 10% of all the gene transcripts/pathways that are the best separators with respect to the given classes. During the triple comparison, three AUC values were calculated for each gene transcript/pathway: Normal vs AML, Normal vs ALL, ALL vs AML, and then averaged to reflect overall separation quality for a given gene transcript/pathway. Average marker PAS/CNR values and the corresponding AUC scores were calculated for each of the sample classes (Normal, AML, ALL) in each comparison.
Supplementary Materials
Conflicts of Interest
The authors have no conflict of interests to declare.
Funding
This work was supported by the Russian Science Foundation grants no. 14-14-01089 and 14-50-00060 (for M. Suntsova, P.Spirin, V.Prassolov and Anton Buzdin), by the Pathway Pharmaceuticals (Hong-Kong) and First Oncology Research and Advisory Center (Russia) Joint Research Initiative and by the Program of the Presidium of the Russian Academy of Sciences “Dynamics and Conservation of Genomes” (for other authors).
References
- 1. Chaudhury SS, Morison JK, Gibson BE, Keeshan K. Insights into cell ontogeny, age, and acute myeloid leukemia. Exp Hematol. 2015; 43:745–55. https://doi.org/10.1016/j.exphem.2015.05.008 [PubMed]
- 2. Döhner H, Weisdorf DJ, Bloomfield CD, Bloomfield CD. Acute Myeloid Leukemia. N Engl J Med. 2015; 373:1136–52. https://doi.org/10.1056/NEJMra1406184 [PubMed]
- 3. Jemal A, Thomas A, Murray T, Thun M. Cancer statistics, 2002. CA Cancer J Clin. 2002; 52:23–47. https://doi.org/10.3322/canjclin.52.1.23 [PubMed]
- 4. Dores GM, Devesa SS, Curtis RE, Linet MS, Morton LM. Acute leukemia incidence and patient survival among children and adults in the United States, 2001-2007. Blood. 2012; 119:34–43. https://doi.org/10.1182/blood-2011-04-347872 [PubMed]
- 5. Inaba H, Greaves M, Mullighan CG. Acute lymphoblastic leukaemia. Lancet. 2013; 381:1943–55. https://doi.org/10.1016/S0140-6736(12)62187-4 [PubMed]
- 6. Seiter K. Acute Lymphoblastic Leukemia, Medscape, 2016.
- 7. Greaves MF. Aetiology of acute leukaemia. Lancet. 1997; 349:344–49. https://doi.org/10.1016/S0140-6736(96)09412-3 [PubMed]
- 8. Zhou Y, You MJ, Young KH, Lin P, Lu G, Medeiros LJ, Bueso-Ramos CE. Advances in the molecular pathobiology of B-lymphoblastic leukemia. Hum Pathol. 2012; 43:1347–62. https://doi.org/10.1016/j.humpath.2012.02.004 [PubMed]
- 9. Zalcberg IQ, Silva ML, Abdelhay E, Tabak DG, Ornellas MH, Simões FV, Pucheri W, Ribeiro R, Seuánez HN. Translocation 11;14 in three children with acute lymphoblastic leukemia of T-cell origin. Cancer Genet Cytogenet. 1995; 84:32–38. https://doi.org/10.1016/0165-4608(95)00062-3 [PubMed]
- 10. George J, Uyar A, Young K, Kuffler L, Waldron-Francis K, Marquez E, Ucar D, Trowbridge JJ. Leukaemia cell of origin identified by chromatin landscape of bulk tumour cells. Nat Commun. 2016; 7:12166. https://doi.org/10.1038/ncomms12166 [PubMed]
- 11. Wu A-Y, Yang HC, Lin CM, Wu BD, Qu QS, Zheng Y-H, Wei H, Mei XQ, Zeng ZH, Ma XD. The Transcriptome Study of Subtype M2 Acute Myeloblastic Leukemia. Cell Biochem Biophys. 2015; 72:653–56. https://doi.org/10.1007/s12013-014-0432-4 [PubMed]
- 12. Zwaan CM, Kolb EA, Reinhardt D, Abrahamsson J, Adachi S, Aplenc R, De Bont ES, De Moerloose B, Dworzak M, Gibson BE, Hasle H, Leverger G, Locatelli F, et al. Collaborative Efforts Driving Progress in Pediatric Acute Myeloid Leukemia. J Clin Oncol. 2015; 33:2949–62. https://doi.org/10.1200/JCO.2015.62.8289 [PubMed]
- 13. Demetrashvili N, Kron K, Pethe V, Bapat B, Briollais L. How to Deal with Batch Effect in Sequential Microarray Experiments? Mol Inform. 2010; 29:387–93. https://doi.org/10.1002/minf.200900019 [PubMed]
- 14. Buzdin AA, Zhavoronkov AA, Korzinkin MB, Roumiantsev SA, Aliper AM, Venkova LS, Smirnov PY, Borisov NM. The OncoFinder algorithm for minimizing the errors introduced by the high-throughput methods of transcriptome analysis. Front Mol Biosci. 2014; 1:8. https://doi.org/10.3389/fmolb.2014.00008 [PubMed]
- 15. Lodes MJ, Caraballo M, Suciu D, Munro S, Kumar A, Anderson B. Detection of cancer with serum miRNAs on an oligonucleotide microarray. PLoS One. 2009; 4:e6229. https://doi.org/10.1371/journal.pone.0006229 [PubMed]
- 16. Bolstad BM, Irizarry RA, Astrand M, Speed TP. A comparison of normalization methods for high density oligonucleotide array data based on variance and bias. Bioinformatics. 2003; 19:185–93. https://doi.org/10.1093/bioinformatics/19.2.185 [PubMed]
- 17. Makarev E, Izumchenko E, Aihara F, Wysocki PT, Zhu Q, Buzdin A, Sidransky D, Zhavoronkov A, Atala A. Common pathway signature in lung and liver fibrosis. Cell Cycle. 2016; 15:1667–73. https://doi.org/10.1080/15384101.2016.1152435 [PubMed]
- 18. Artcibasova AV, Korzinkin MB, Sorokin MI, Shegay PV, Zhavoronkov AA, Gaifullin N, Alekseev BY, Vorobyev NV, Kuzmin DV, Kaprin АD, Borisov NM, Buzdin AA. MiRImpact, a new bioinformatic method using complete microRNA expression profiles to assess their overall influence on the activity of intracellular molecular pathways. Cell Cycle. 2016; 15:689–98. https://doi.org/10.1080/15384101.2016.1147633 [PubMed]
- 19. Alexandrova E, Nassa G, Corleone G, Buzdin A, Aliper AM, Terekhanova N, Shepelin D, Zhavoronkov A, Tamm M, Milanesi L, Miglino N, Weisz A, Borger P. Large-scale profiling of signalling pathways reveals an asthma specific signature in bronchial smooth muscle cells. Oncotarget. 2016; 7:25150–61. [PubMed]
- 20. Lebedev TD, Spirin PV, Suntsova MV, Ivanova AV, Buzdin AA, Prokofjeva MM, Rubtsov PM, Prassolov VS. [Receptor tyrosine kinase KIT may regulate expression of genes involved in spontaneous regression of neuroblastoma]. Mol Biol (Mosk). 2015; 49:1052–55. Receptor tyrosine kinase KIT may regulate expression of genes involved in spontaneous regression of neuroblastoma [PubMed]
- 21. Buzdin AA, Zhavoronkov AA, Korzinkin MB, Venkova LS, Zenin AA, Smirnov PY, Borisov NM. Oncofinder, a new method for the analysis of intracellular signaling pathway activation using transcriptomic data. Front Genet. 2014; 5:55. https://doi.org/10.3389/fgene.2014.00055 [PubMed]
- 22. Green DM, Swets JA. Signal Detection Theory and Psychophysics. Wiley, New York. 1966.
- 23. Boyd JC. Mathematical tools for demonstrating the clinical usefulness of biochemical markers. Scand J Clin Lab Invest Suppl. 1997; 227:46–63. https://doi.org/10.1080/00365519709168308 [PubMed]
- 24. Bi L, Wu J, Ye A, Wu J, Yu K, Zhang S, Han Y. Increased Th17 cells and IL-17A exist in patients with B cell acute lymphoblastic leukemia and promote proliferation and resistance to daunorubicin through activation of Akt signaling. J Transl Med. 2016; 14:132. https://doi.org/10.1186/s12967-016-0894-9 [PubMed]
- 25. Perez DR, Smagley Y, Garcia M, Carter MB, Evangelisti A, Matlawska-Wasowska K, Winter SS, Sklar LA, Chigaev A. Cyclic AMP efflux inhibitors as potential therapeutic agents for leukemia. Oncotarget. 2016; 7:33960–82. [PubMed]
- 26. Ruiz-Moreno C, Jimenez-Del-Rio M, Sierra-Garcia L, Lopez-Osorio B, Velez-Pardo C. Vitamin E synthetic derivate-TPGS-selectively induces apoptosis in jurkat t cells via oxidative stress signaling pathways: implications for acute lymphoblastic leukemia. Apoptosis. 2016; 21:1019–32. https://doi.org/10.1007/s10495-016-1266-x [PubMed]
- 27. Fortin J, Bassi C, Mak TW. PTEN enables the development of pre-B acute lymphoblastic leukemia. Nat Med. 2016; 22:339–40. https://doi.org/10.1038/nm.4083 [PubMed]
- 28. Negi SS, Brown P. rRNA synthesis inhibitor, CX-5461, activates ATM/ATR pathway in acute lymphoblastic leukemia, arrests cells in G2 phase and induces apoptosis. Oncotarget. 2015; 6:18094–104. https://doi.org/10.18632/oncotarget.4093 [PubMed]
- 29. Dagklis A, Pauwels D, Lahortiga I, Geerdens E, Bittoun E, Cauwelier B, Tousseyn T, Uyttebroeck A, Maertens J, Verhoef G, Vandenberghe P, Cools J. Hedgehog pathway mutations in T-cell acute lymphoblastic leukemia. Haematologica. 2015; 100:e102–05. https://doi.org/10.3324/haematol.2014.119248 [PubMed]
- 30. Kim JG, Sohn SK, Kim DH, Baek JH, Lee NY, Suh JS, Chae SC, Lee KS, Lee KB. Clinical implications of angiogenic factors in patients with acute or chronic leukemia: hepatocyte growth factor levels have prognostic impact, especially in patients with acute myeloid leukemia. Leuk Lymphoma. 2005; 46:885–91. https://doi.org/10.1080/10428190500054491 [PubMed]
- 31. Wang X-J, Xu YH, Yang GC, Chen HX, Zhang P. Tetramethylpyrazine inhibits the proliferation of acute lymphocytic leukemia cell lines via decrease in GSK-3β. Oncol Rep. 2015; 33:2368–74. [PubMed]
- 32. Benninghoff AD, Williams DE. The role of estrogen receptor β in transplacental cancer prevention by indole-3-carbinol. Cancer Prev Res (Phila). 2013; 6:339–48. https://doi.org/10.1158/1940-6207.CAPR-12-0311 [PubMed]
- 33. Sarang Z, Gyurina K, Scholtz B, Kiss C, Szegedi I. Altered expression of autophagy-related genes might contribute to glucocorticoid resistance in precursor B-cell-type acute lymphoblastic leukemia. Eur J Haematol. 2016; 97:453–60. https://doi.org/10.1111/ejh.12753 [PubMed]
- 34. Triplett TA, Cardenas KT, Lancaster JN, Hu Z, Selden HJ, Jasso GJ, Balasubramanyam S, Chan K, Li L, Chen X, Marcogliese AN, Davé UP, Love PE, Ehrlich LI. Endogenous dendritic cells from the tumor microenvironment support T-ALL growth via IGF1R activation. Proc Natl Acad Sci USA. 2016; 113:E1016–25. https://doi.org/10.1073/pnas.1520245113 [PubMed]
- 35. Foa R. Interleukin-2 and gene therapy in the management of acute lymphoblastic leukaemia. Baillieres Clin Haematol. 1994; 7:421–34. https://doi.org/10.1016/S0950-3536(05)80211-2 [PubMed]
- 36. Zhou X, Zhou S, Li B, Li Q, Gao L, Li D, Gong Q, Zhu L, Wang J, Wang N, Huang L, Zhao L, Li Z, Zhou J. Transmembrane TNF-α preferentially expressed by leukemia stem cells and blasts is a potent target for antibody therapy. Blood. 2015; 126:1433–42. https://doi.org/10.1182/blood-2015-01-624833 [PubMed]
- 37. de la Puente P, Weisberg E, Muz B, Nonami A, Luderer M, Stone RM, Melo JV, Griffin JD, Azab AK. Identification of ILK as a novel therapeutic target for acute and chronic myeloid leukemia. Leuk Res. 2015; 39:1299–308. https://doi.org/10.1016/j.leukres.2015.09.005 [PubMed]
- 38. Layton Tovar CF, Mendieta Zerón H. Intracellular Signaling Pathways Involved in Childhood Acute Lymphoblastic Leukemia; Molecular Targets. Indian J Hematol Blood Transfus. 2016; 32:141–53. https://doi.org/10.1007/s12288-015-0609-z [PubMed]
- 39. Nicholson L, Evans CA, Matheson E, Minto L, Keilty C, Sanichar M, Case M, Schwab C, Williamson D, Rainer J, Harrison CJ, Kofler R, Hall AG, et al. Quantitative proteomic analysis reveals maturation as a mechanism underlying glucocorticoid resistance in B lineage ALL and re-sensitization by JNK inhibition. Br J Haematol. 2015; 171:595–605. https://doi.org/10.1111/bjh.13647 [PubMed]
- 40. Dinner S, Platanias LC. Targeting the mTOR Pathway in Leukemia. J Cell Biochem. 2016; 117:1745–52. https://doi.org/10.1002/jcb.25559 [PubMed]
- 41. Rouce RH, Shaim H, Sekine T, Weber G, Ballard B, Ku S, Barese C, Murali V, Wu MF, Liu H, Shpall EJ, Bollard CM, Rabin KR, Rezvani K. The TGF-β/SMAD pathway is an important mechanism for NK cell immune evasion in childhood B-acute lymphoblastic leukemia. Leukemia. 2016; 30:800–11. https://doi.org/10.1038/leu.2015.327 [PubMed]
- 42. Ryan SL, Matheson E, Grossmann V, Sinclair P, Bashton M, Schwab C, Towers W, Partington M, Elliott A, Minto L, Richardson S, Rahman T, Keavney B, et al. The role of the RAS pathway in iAMP21-ALL. Leukemia. 2016; 30:1824–31. https://doi.org/10.1038/leu.2016.80 [PubMed]
- 43. Takenokuchi M, Saigo K, Nakamachi Y, Kawano S, Hashimoto M, Fujioka T, Koizumi T, Tatsumi E, Kumagai S. Troglitazone inhibits cell growth and induces apoptosis of B-cell acute lymphoblastic leukemia cells with t(14;18). Acta Haematol. 2006; 116:30–40. https://doi.org/10.1159/000092345 [PubMed]
- 44. Hillis J, O’Dwyer M, Gorman AM. Neurotrophins and B-cell malignancies. Cell Mol Life Sci. 2016; 73:41–56. https://doi.org/10.1007/s00018-015-2046-4 [PubMed]
- 45. Iranparast S, Assarehzadegan MA, Heike Y, Hossienzadeh M, Khodadadi A. Wilms’ tumor gene (WT1) expression correlates with vascular epithelial growth factor (VEGF) in newly acute leukemia patients undergoing chemotherapy. Asian Pac J Cancer Prev. 2014; 15:9217–23. https://doi.org/10.7314/APJCP.2014.15.21.9217 [PubMed]
- 46. Belmonte M, Hoofd C, Weng AP, Giambra V. Targeting leukemia stem cells: which pathways drive self-renewal activity in T-cell acute lymphoblastic leukemia? Curr Oncol. 2016; 23:34–41. https://doi.org/10.3747/co.23.2806 [PubMed]
- 47. Yonekura S, Itoh M, Okuhashi Y, Takahashi Y, Ono A, Nara N, Tohda S. Effects of the HIF1 inhibitor, echinomycin, on growth and NOTCH signalling in leukaemia cells. Anticancer Res. 2013; 33:3099–103. [PubMed]
- 48. Walker AR, Wang H, Walsh K, Bhatnagar B, Vasu S, Garzon R, Canning R, Geyer S, Wu YZ, Devine SM, Klisovic R, Blum W, Marcucci G. Midostaurin, bortezomib and MEC in relapsed/refractory acute myeloid leukemia. Leuk Lymphoma. 2016; 57:2100–08. https://doi.org/10.3109/10428194.2015.1135435 [PubMed]
- 49. Fernandes MS, Reddy MM, Croteau NJ, Walz C, Weisbach H, Podar K, Band H, Carroll M, Reiter A, Larson RA, Salgia R, Griffin JD, Sattler M. Novel oncogenic mutations of CBL in human acute myeloid leukemia that activate growth and survival pathways depend on increased metabolism. J Biol Chem. 2010; 285:32596–605. https://doi.org/10.1074/jbc.M110.106161 [PubMed]
- 50. Hock BD, McKenzie JL, Patton NW, Drayson M, Taylor K, Wakeman C, Kantarjian H, Giles F, Albitar M. Circulating levels and clinical significance of soluble CD40 in patients with hematologic malignancies. Cancer. 2006; 106:2148–57. https://doi.org/10.1002/cncr.21816 [PubMed]
- 51. Spirin PV, Lebedev TD, Orlova NN, Gornostaeva AS, Prokofjeva MM, Nikitenko NA, Dmitriev SE, Buzdin AA, Borisov NM, Aliper AM, Garazha AV, Rubtsov PM, Stocking C, Prassolov VS. Silencing AML1-ETO gene expression leads to simultaneous activation of both pro-apoptotic and proliferation signaling. Leukemia. 2014; 28:2222–28. https://doi.org/10.1038/leu.2014.130 [PubMed]
- 52. Scales M, Jäger R, Migliorini G, Houlston RS, Henrion MY. visPIG--a web tool for producing multi-region, multi-track, multi-scale plots of genetic data. PLoS One. 2014; 9:e107497. https://doi.org/10.1371/journal.pone.0107497 [PubMed]