Gerosuppression by pan-mTOR inhibitors
Abstract
Rapamycin slows organismal aging and delays age-related diseases, extending lifespan in numerous species. In cells, rapamycin and other rapalogs such as everolimus suppress geroconversion from quiescence to senescence. Rapamycin inhibits some, but not all, activities of mTOR. Recently we and others demonstrated that pan-mTOR inhibitors, known also as dual mTORC1/C2 inhibitors, suppress senescent phenotype. As a continuation of these studies, here we investigated in detail a panel of pan-mTOR inhibitors, to determine their optimal gerosuppressive concentrations. During geroconversion, cells become hypertrophic and flat, accumulate lysosomes (SA-beta-Gal staining) and lipids (Oil Red staining) and lose their re-proliferative potential (RPP). We determined optimal gerosuppressive concentrations: Torin1 (30 nM), Torin 2 (30 nM), AZD8055 (100 nM), PP242 (300 nM), both KU-006379 and GSK1059615 (1000 nM). These agents decreased senescence-associated hypertrophy with IC50s: 20, 18, 15, 200 and 400 nM, respectively. Preservation of RPP by pan-mTOR inhibitors was associated with inhibition of the pS6K/pS6 axis. Inhibition of rapamycin-insensitive functions of mTOR further contributed to anti-hypertrophic and cytostatic effects. Torin 1 and PP242 were more “rapamycin-like” than Torin 2 and AZD8055. Pan-mTOR inhibitors were superior to rapamycin in suppressing hypertrophy, senescent morphology, Oil Red O staining and in increasing so-called “chronological life span (CLS)”. We suggest that, at doses lower than anti-cancer concentrations, pan-mTOR inhibitors can be developed as anti-aging drugs.
Introduction
Rapamycin slows down aging in yeast [1,2], Drosophila [3–7], worm [8] and mice [9–30]. It also delays age-related diseases in a variety of species including humans [31–46]. Numerous studies have demonstrated life extension by rapamycin in rodent models of human diseases [9–48]. The maximal lifespan extension is dose-dependent [26,42,49]. One explanation is trivial: the higher the doses, the stronger inhibition of mTOR. There is another explanation: mTOR complex 1 (mTORC1) has different affinity for its substrates. For example, inhibition of phosphorylation of S6K is achieved at low concentrations of rapamycin, whereas phosphorylation of 4EBP1 at T37/46 sites is insensitive to pharmacological concentrations of rapamycin [50–61]. Unlike rapalogs, ATP-competitive kinase inhibitors, also known as dual mTORC1/C2 or pan-mTOR inhibitors, directly inhibit the mTOR kinase in both mTORC1 and mTORC2 complexes [56,59,62–65].
In cell culture, induction of senescence requires two events: cell cycle arrest and mTOR-dependent geroconversion from arrest to senescence [66–75]. In proliferating cells, mTOR is highly active, driving cellular mass growth. When the cell cycle gets arrested, then still active mTOR drives geroconversion: growth without division (hypertrophy) and a compensatory lysosomal hyperfunction (beta-Gal staining) [76]. So senescence can be caused by forced arrest in the presence of an active mTOR [76]. Senescent cells lose re-proliferative potential (RPP): the ability to regenerate cell culture after cell cycle arrest is lifted. Quiescence or reversible arrest, in contrast, is caused by deactivation of mTOR. When arrest is released, quiescent cells re-proliferate [66,67].
In one cellular model of senescence (cells with IPTG-inducible p21), IPTG forces cell cycle arrest without affecting mTOR. During IPTG-induced arrest, the cells become hypertrophic, flat, SA-beta-Gal positive and lose RPP. When IPTG is washed out, such cells cannot resume proliferation. Loss of RPP is a simple quantitative test of geroconversion. Treatment with rapamycin during IPTG-induced arrest preserves RPP. When IPTG and rapamycin are washed out, cells re-proliferate [68–73,77]. Recently, we have shown that Torin 1 and PP242 suppresses geroconversion, preventing senescent morphology and loss of RPP [78,79]. In agreement, reversal of senescent phenotype was shown by another pan-mTOR inhibitor, AZD8085 [80].
Pan-mTOR inhibitors have been developed as cytostatics to inhibit cancer cell proliferation. Cytostatic side effects in normal cells are generally acceptable for anti-cancer drugs. However, cytostatic side effects may not be acceptable for anti-aging drugs. Gerosuppressive (anti-aging) effects at drug concentrations that only mildly cytostatic are desirable. Pan-mTOR inhibitors differ by their affinity for mTOR complexes and other kinases. Here we studied 6 pan-mTOR inhibitors (in comparison with rapamycin) and investigated effects of 6 pan-mTOR inhibitors on rapamycin-sensitive and -insensitive activities of mTOR, cell proliferation and geroconversion.
Results
First we investigated the relationship between cytostatic and gerosuppressive activities of 6 pan-mTOR inhibitors: Torin1, Torin 2, AZD8055, PP242, KU-006379 and GSK1059615. All inhibitors inhibited proliferation in a dose-dependent manner (Fig. 1A). Inhibitory concentrations 50 (IC50) varied: Torin1 (22 nM), Torin 2 (8 nM), AZD8055 (20 nM), PP242 (285 nM), KU-006379 (230 nM) and GSK1059615 (>300 nM). At IC50, no cell death was observed. The inhibitory effect was cytostatic rather than cytotoxic and, furthermore, reversible (Fig. 1B). When cells were treated with pan-mTOR inhibitors for 4 days and then re-plated and incubated in drug-free medium, the cells re-proliferated as efficiently as untreated control cells (Fig. 1B).
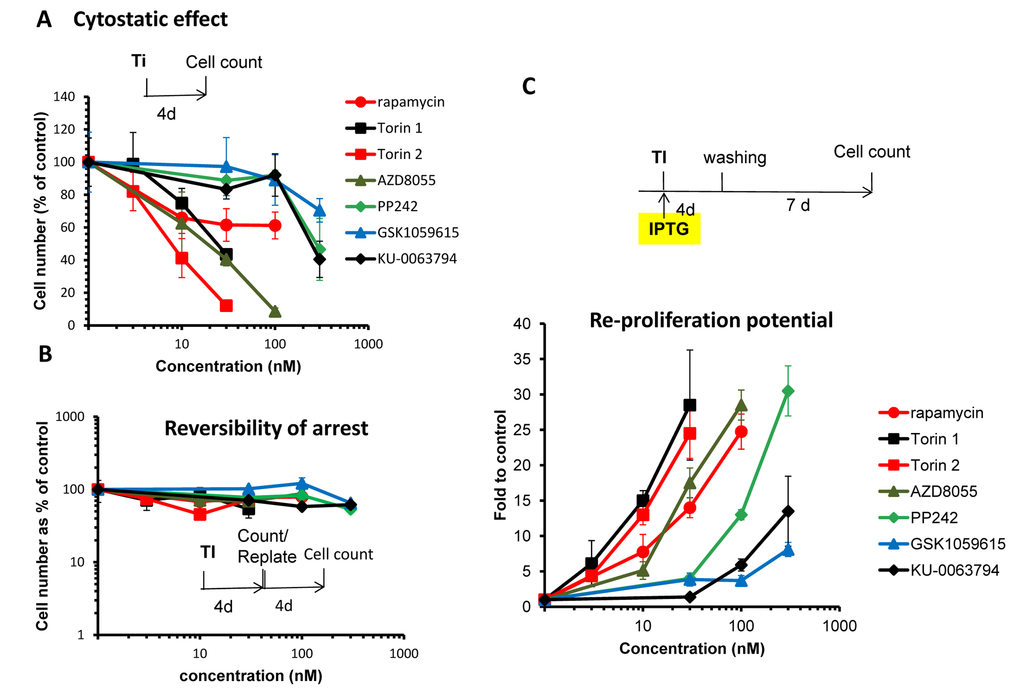
Figure 1. (A) Cytostatic effect. Effect of TOR inhibitors (Ti) on proliferation. HT-p21 cells were treated with serial dilutions of indicated Ti for 4 days and counted in triplicates. Data presented as mean ± SD. (B) Reversibility. Cells were treated as in A. After 4 day-treatment cells were counted and re-plated at 1000/well in 6-well plates in drug-free medium. Cells were allowed to re-proliferate for 4 days and counted. Cytostatic arrest was fully reversible. (C) Gerosuppression. Effect of TOR inhibitors on re-proliferative potential. HT-p21 cells were treated with IPTG in the presence of different concentrations of indicated Ti in triplicates. After 4 day-treatment, cells were washed off the drugs and allowed to regrow in drug-free medium for 7 days and counted. Data presented as mean ± SD.
In the same cell line, HT-p21, we also measured gerosuppressive activities of mTOR inhibitors, by measuring re-proliferative potential (RPP) after induction of senescence with IPTG (Fig. 1C and Suppl. Fig. S1). In HT-p21 cells, IPTG induces p21, which in turn causes cell cycle arrest [76]. During cell cycle arrest, mTOR drives geroconversion to senescence, characterized by loss of RPP [68–73,77]. Loss of RPP becomes evident after washing IPTG out. Although cells re-enter cell cycle, they cannot proliferate [81]. Inhibitors of mTOR preserved RPP in IPTG-treated cells. When IPTG and inhibitors of mTOR were washed out, the cells re-proliferated. By counting cell numbers after IPTG is washed out, we can measure gerosuppressive effects of mTOR inhibitors.
As shown in figure 1C and S1, all TOR inhibitors demonstrated equal maximal gerosuppressive activity, however, at different concentrations. Therefore, they have equal efficacy and different potency. (Note: Efficacy: maximum effect that mTOR inhibitor can cause regardless of concentration. Potency: concentration that is needed to cause this effect.) When we compared cytostatic versus gerosuppressive effects for each compound (Fig S2), we noticed that the gerosuppressive effect mirrored the cytostatic effect. The lower concentration was required to inhibit proliferation, the lower concentration was required to suppress geroconversion (Suppl. Fig. S2). We estimated concentration at which compounds exerted maximum gerosuppressive effect (Fig. 1C, Suppl. Fig. S1). Torins 1 and 2 turned out to be the most potent and GSK1059615 was the least potent. Torin 1 and 2 showed the same maximal effect in suppressing geroconversion at 30 nM (Fig. 1C and Suppl. Fig. S1). Maximal gerosuppressive effect was achieved by GSK1059615 and KU-0063794 at 1000 nM (Suppl. Fig. S1). AZD8055 displayed maximum gerosuppressive effect at 100 nM. As seen in figure S1, gerosuppressive effects reached the plateau and then decreased at higher concentrations, due to toxicity.
Preservation of RPP correlated with inhibition of mTORC1
MTOR complex 1 (mTORC1) phosphorylates S6 kinase (S6K) at T389, which in turn phosphorylates S6 at S235/236 and S240/244. This S6K/S6 axis is rapamycin-sensitive. Phosphorylation of 4EBP1 at T37/46 is rapamycin-insensitive. Function of mTORC2, which is rapamycin-insensitive, can be measured by phospho-AKT (S473), albeit it is not the only kinase that phosphorylates Akt at that site.
At optimal gerosuppressive concentrations, pan-mTOR inhibitors decreased phosphorylation of S6K at T389 (target of mTORC1) and its downstream targets S6 (S235/236) and (S240/244) (Fig. 2 and Suppl. Fig. S3). At optimal concentration (30 nM), Torin 2 inhibited phosphorylation of AKT at S473 and T308. Other inhibitors, at optimal gerosuppressive concentrations, did not decrease phosphorylation of AKT or even caused an increase in level of pAKT(S473) and/or pAKT(T308) similar to the effect of rapamycin, which induces phosphorylation of AKT in HT-p21 cells (Fig. 2). We conclude that mTORC2 and/or AKT in particular are not essential for geroconversion, as measured by RPP, in HT-p21 cells. Phosphorylation status of 4EBP1, a substrate of TORC1, was revealing. Rapamycin caused mobility shift but did not inhibit phosphorylation at the particular T37/46 sites. Torin 2 inhibited 4EBP1 phosphorylation at T37/46 sites. At optimal gerosuppressive concentrations, all other pan-mTOR inhibitors caused mobility shift and only marginally decreased T37/46 phosphorylation, which however was inhibited at higher concentrations (Fig. 2 and Suppl. Fig. S3).
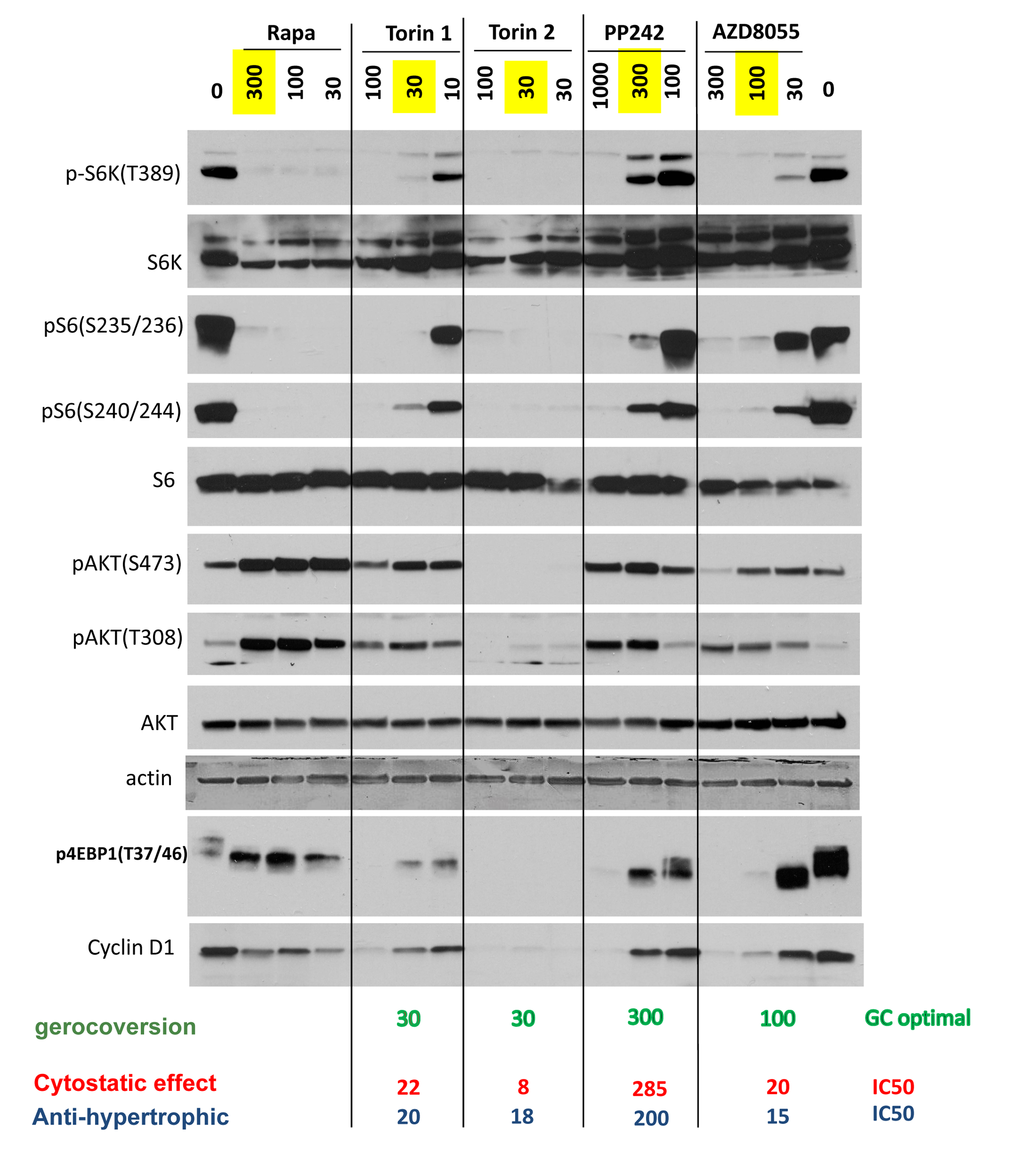
Figure 2. Effect of TOR inhibitors on mTOR-pathway in HT-p21 cells. Cells were treated with IPTG and different concentrations of indicated inhibitors for 24h and lysed. Immunoblotting was performed with indicated antibodies. Maximal optimal gerosuppressive concentrations are highlighted in yellow.
Pan-mTOR inhibitors prevent cellular hypertrophy
We next determined effects of mTOR inhibitors on senescence-associated hypertrophy in IPTG-arrested HT-p21 cells. Hypertrophy can be measured as protein per cell [82]. IPTG induces cell cycle arrest, so that cells do not proliferate and the number of plated cells stays the same throughout the treatment [82]. Therefore, hypertrophy can be easily determined by measuring protein per well. We treated cells with IPTG and its combination with mTOR inhibitors. After a 4 day-treatment, cells were lysed and protein was measured. Pan-mTOR inhibitors decreased cellular hypertrophy in a dose-dependent manner. Rapamycin was an exception, i.e. its inhibitory effect on cellular hypertrophy was moderate and reached a plateau. IC50 values were as follows: 20, 18, 15, 200 and 400 nM for Torin 1, Torin 2, AZD8085, PP242 and GSK1059615, respectively (Fig. 3). All inhibitors reduced amount of protein by more than 50% at concentrations corresponding to their optimal gerosuppressive concentrations measured by RPP.
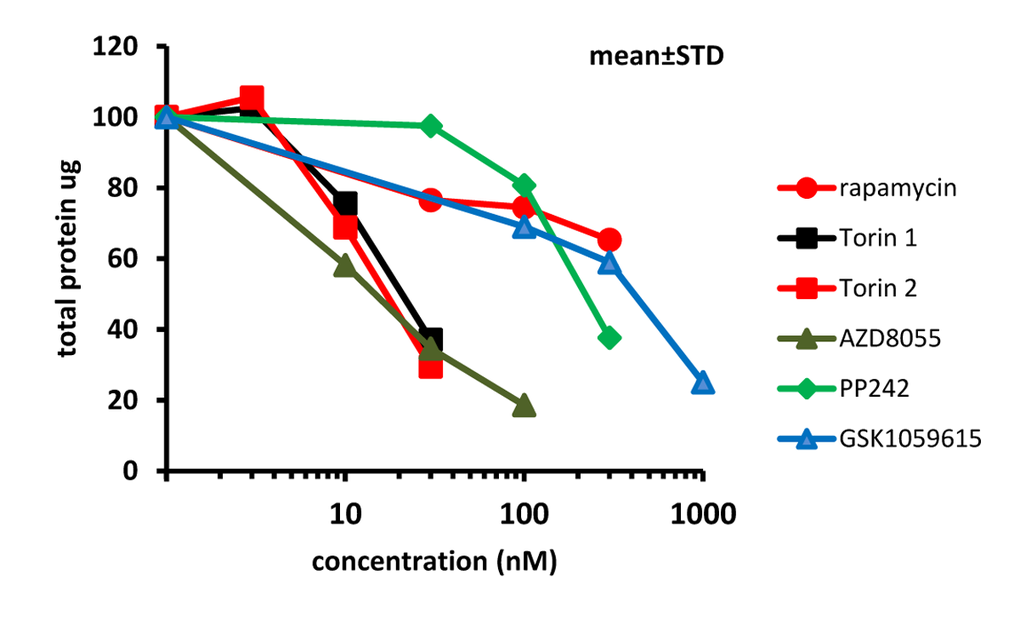
Figure 3. Effect of TORINs on protein level in senescent HT-p21 cells. Cells were treated with IPTG and different concentrations of TORINs for 4 days and protein amounts were measured. Data are mean ± SD.
We next employed additional method of measuring cellular hypertrophy by measuring GFP under CMV-constitutive promoter in HT-p21 cells. (HT-p21 cells are stably transfected with GFP-CMV). It was previously shown that GFP accumulation is a marker of hypertrophy [82]. Torin 2 was more potent anti-hypertrophic agent than Torin 1 (Fig. 4A). IC50 values were 3 nM and 10 nM for torn 1 and 2, respectively (Fig. 4A). At 30 nM, both Torins were more anti-hypertrophic than rapamycin (Fig. 4A, rapamycin was used at 500 nM). Anti-hypertrophic effect of Torins was independent of the nature of senescence-inducing agent, i.e. IPTG-inducible ectopic p21 or inhibitor of CDK4/6 PD0332991 (Fig. 4B, C). We conclude that Torins blocked senescence-associated hypertrophy more effectively compared with rapamycin. Furthermore, Torin 1, which is more rapamycin-like than Torin 2, was less potent as anti-hypertrophic agent than Torin 2.
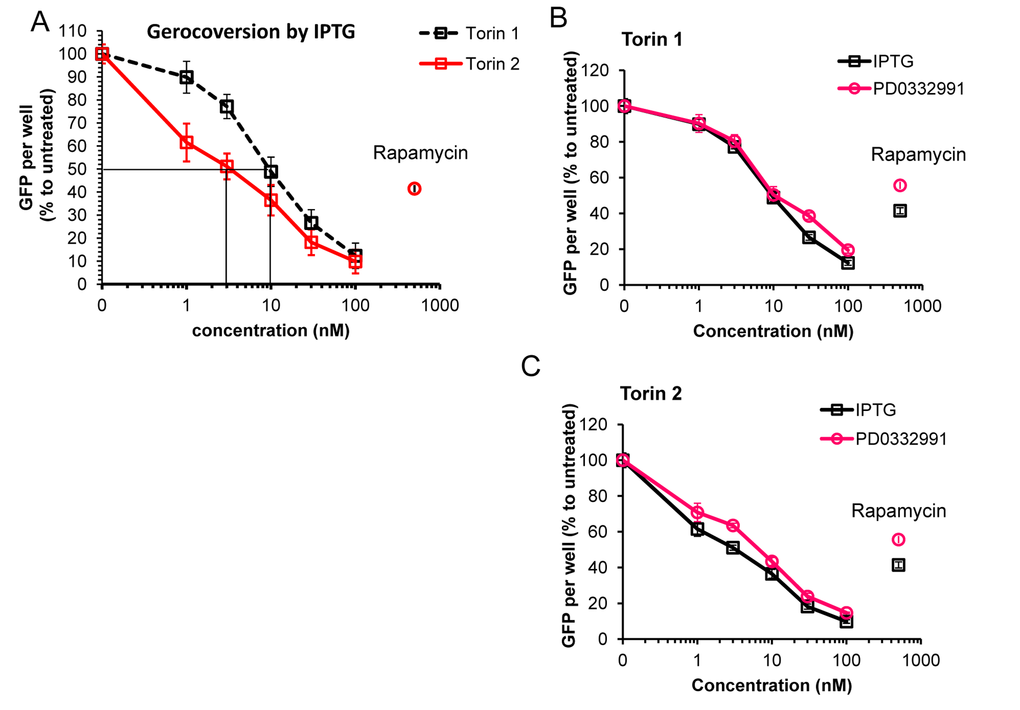
Figure 4. Effect of torins 1 and 2 on hypertrophy of senescent HT-p21 cells measured by constitutive GFP fluorescence of these cells. (A) HT-p21 cells were treated with IPTG and concentration range of torin1 or torin 2, rapamycin (500 nM) was included for comparison as additional control. After 4 day-treatment GFP fluorescence was quantified using Typhoon scanner (Amersham Biosciences variable mode imager) and ImageQuantTL software. (B) and (C) HT-p21 cells were induce to senesce by treatment with either IPTG (3 days) or PD0332991 (0.5 µM, for 4 days) and concentration range of torin 1 (B) or torin 2 (C). Effect of torins on hypertrophy was assessed by measuring GFP fluorescence as described in (A). GFP per well is presented as % to IPTG or PD0332991 only treated cells for each set. Data are means ± SE of 8 replicates from one out of three independent experiments.
Torins 1 and 2 decrease lipid accumulation in senescing cells
One of the features of senescent HT-p21 cells is accumulation of lipids, which is detected as positive Oil Red O staining in perinuclear region (Fig. 5, IPTG). When these cells were co-treated with IPTG and Torins 1 or 2, cells remained small and Oil Red O negative (Fig. 5). As in the case of SA-beta-Gal staining, rapamycin was less effective than Torins in decreasing this marker of senescent HT-p21 cells.
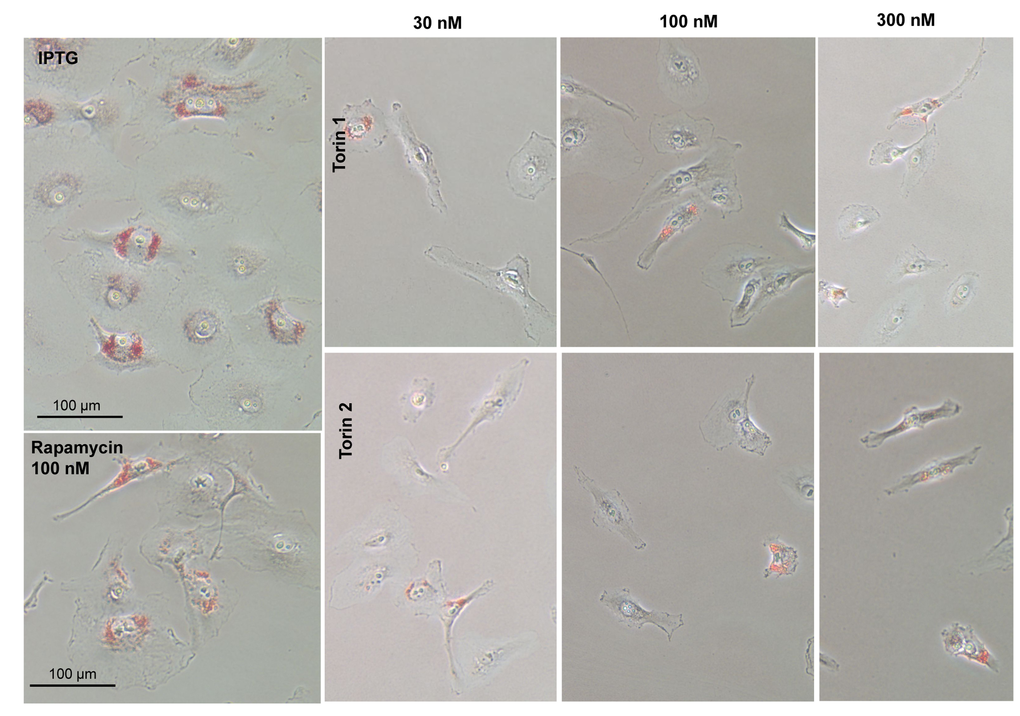
Figure 5. Effect of torin analogs on lipid accumulation in senescent HT-p21 cells. Cells were treated with IPTG and concentrations range of torin 1or torin 2 for 4 days and stained with Oil Red O. Bar – 100 µm.
Pan-mTOR inhibitors prolongs CLS in HT-p21 cells
The yeast is commonly used as a model of aging. In particular, rapamycin extends chronological lifespan (CLS) [2]. In stationary culture, yeast cells lose viability measured as re-proliferative potential in fresh culture [1–7]. It is erroneously believed that “chronological aging” is an equivalent of aging of post-mitotic cells in multicellular organism. In reality, this phenomenon is an equivalent of lose of cancer cell viability in overcrowded culture [83]. Both yeast and cancer cells acidify the culture medium and lose viability, as measured for example by re-proliferation in fresh low-density culture. When plated at very high cell density, HT-p21 cells produce high levels of lactic acid, acidifying medium (“yellow color”). This causes loss of re-proliferative potential [83]. Rapamycin extends CLS by decreasing lactate production [83]. Here we tested whether pan-mTOR inhibitors can extend CLS of HT-p21 cells. After 3 days in a high-density culture, HT-p21 cells remained alive, but could not re-proliferate and form colonies when re-plated in fresh medium (Fig. 6, control). When high-density cultures were treated with mTOR inhibitors, these cells produced less lactic acid as seen by the color of the medium (Fig. 6; yellow indicates low pH and high levels of lactic acid) [84]. They maintained re-proliferative potential and formed colonies when re-plated in fresh medium in low density (Fig. 6). Rapamycin was less effective than pan-mTOR inhibitors. At equipotent (optimal) concentrations, all pan-mTOR inhibitors showed similar efficacy in prolonging chronological life span.
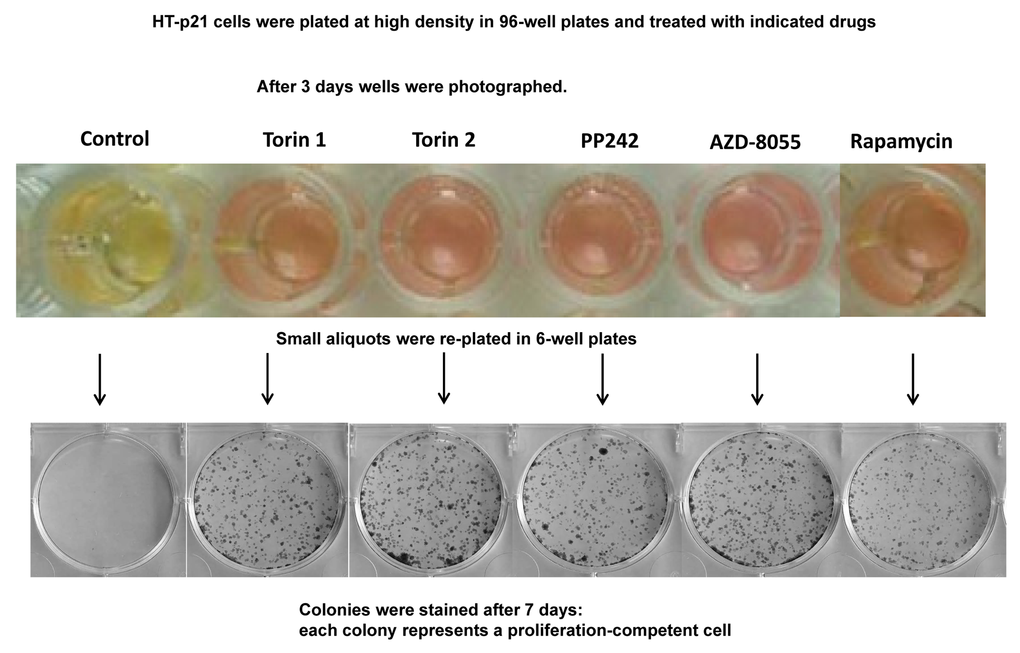
Figure 6. Effect of TOR inhibitors on chronological senescence of cancer HT-p21 cells. Cells were plated at high density in 96-well plates and treated with TOR inhibitors or rapamycin at selected optimal concentrations. After 3 days in culture cells were photographed (color manifests pH of medium), trypsinized and small aliquots were re-plated in 6-well plates. Formed colonies were stained after 7 days in culture with Crystal Violet.
Pan-mTOR inhibitors suppress senescent morphology of SKBR3 and MEL10 cells
We next investigated gerosupressive effects of mTOR inhibitors in SKBR3 and MEL10 cells undergoing geroconversion after treatment with CDK4/6 inhibitor PD0332991 and nutlin-3a, respectively [72]. As shown in Fig 7, treatment with PD0332991 caused senescent morphology in SKBR3 cells. Co-treatment with pan-mTOR inhibitors prevented senescent morphology and hypertrophy (Fig. 7 and Suppl. Fig. S4A). Pan-mTOR inhibitors also prevented senescent morphology of MEL10 cells induced to senesce by treatment with low concentration of nutlin-3a (Fig. 8 and Suppl. Fig. S4B).
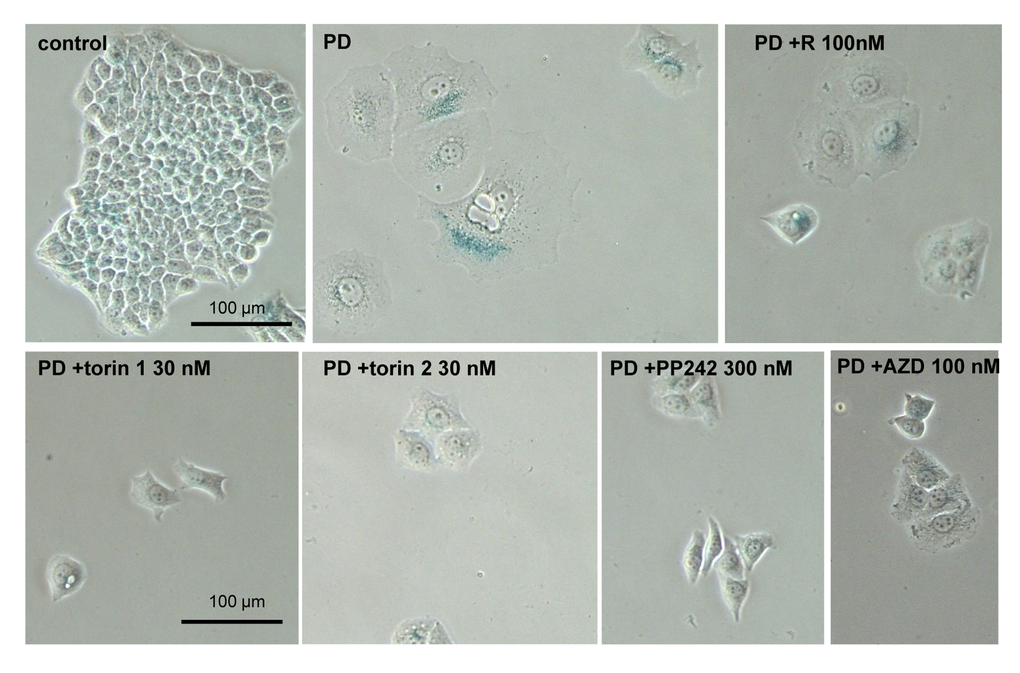
Figure 7. Effect of TORINs on senescent morphology of SKBR3 cells induced to senesce by treatment with PD0332991. Cells were treated with selected concentrations of TORINs and 10 µM PD0332991 (PD). After 4-day treatment drugs were washed out and cells were incubated in drug free medium for 2 days and stained for SA-beta-gal. Bar – 100 µm.
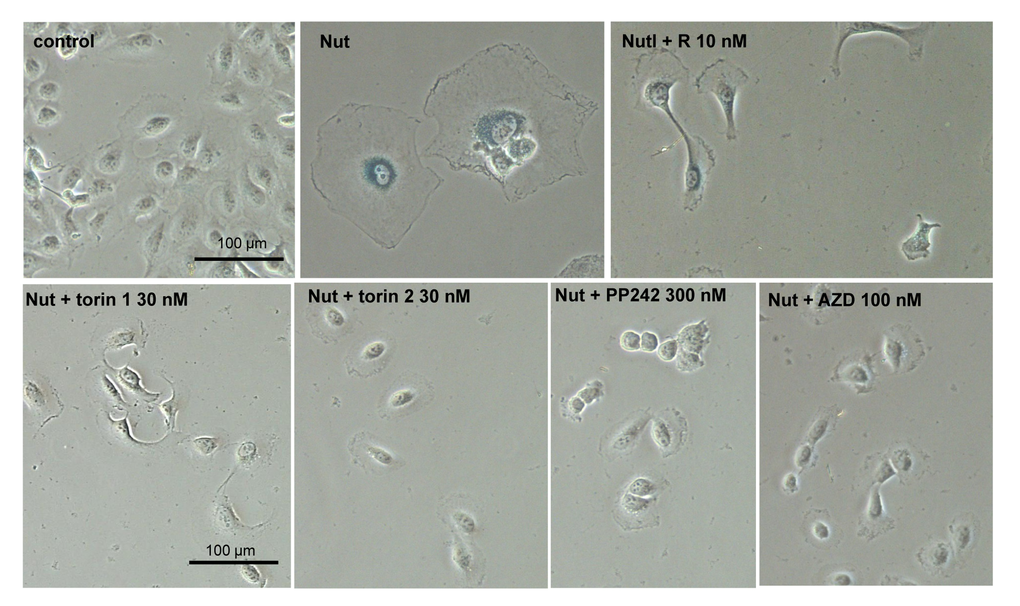
Figure 8. Effect of TORINs on senescent morphology of MEL10 cells undergoing senescence by treatment with nutlin 3a. Cells were treated with nutlin 3a (2.5 µM) and TORINs at selected concentrations or rapamycin (R). After 4-day treatment drugs were washed out and cells were incubated in drug-free medium for another 2 days and stained for SA-beta-gal. Bar – 100 µm. Nut – nutlin 3a; AZD – AZD8085.
Discussion
As predicted by theory of TOR-driven aging [29,85–97], rapamycin extends life span and prevents age-related diseases (see Introduction). Yet, rapamycin (and other rapalogs such as everolimus) does not inhibit all functions of mTOR. Inhibition of both rapamycin-sensitive and --insensitive functions of mTOR may be translated in superior anti-aging effects. However, potential benefits may be limited by undesirable effects such as inhibition of cell proliferation (cytostatic effect) and cell death (cytotoxic effect). In fact, pan-mTOR inhibitors have been developed to treat cancer, so they are cytostatic and cytotoxic at intended anti-cancer concentrations. Yet, the window between gerosupressive and cytotoxic effects exists. At optimal gerosuppressive concentrations, pan-mTOR inhibitors caused only mild cytostatic effect. For Torin 1 and PP242, the ratio of gerosuppressive (measured by RPP) to cytostatic concentrations was the most favorable. The ratio of anti-hypertrophic to cytostatic concentration was similar for all pan-mTOR inhibitors.
Gerosuppressive effect of pan-mTOR inhibitors (as measured by RPP) was equal to that of rapamycin because it is mostly associated with inhibition of the S6K/S6 axis. Yet anti-hypertrophic effect as well as prevention of SA-beta-Gal staining and large cell morphology was more pronounced with pan-mTOR inhibitors than with rapamycin. Also, at optimal concentrations, all pan-mTOR inhibitors extended loss of re-proliferative potential in stationary cell culture more potently than rapamycin. This test determines hyper-metabolism and lactic acid production and is an equivalent of “yeast CLS” (see [83]. One conclusion is that pan-mTOR inhibitors may be superior to rapamycin.
At low concentrations, pan-mTOR inhibitors acted like rapamycin, inhibiting the S6K/S6 axis and causing mobility shift of 4EBP1 (Fig. 2). With increasing concentrations, these drugs inhibited phospho-4EBP1 (T37/46) followed by inhibition of phospho-AKT (S473) (Fig. 2) and thereby further contributed to anti-hypertrophic effects (and cytostatic effect), prevention of senescent morphology as well as inhibition of CLS. Importantly, effects of pan-mTOR inhibitors varied in their resemblance to rapamycin effects. In particular, Torin 1 and PP242 were rapamycin-like. The window between inhibition of pS6K/S6 versus p4EBP1 and AKT was narrower for Torin 2 and AZD8085 than for other 4 pan-mTOR inhibitors. In general, maximal gerosuppression (as measured by RPP) was achieved at concentrations that inhibited phosphorylation of S6K and S6 and only partially inhibited rapamycin-insensitive functions of mTOR. Rapamycin-like effects achieved at lower concentrations of pan-mTOR inhibitors than rapamycin–unlike effects. Preservation of RPP depends on rapamycin-sensitive functions. Inhibition of senescent morphology (SA-beta-Gal staining, hypertrophy, flat morphology) and CLS depends on both rapamycin-sensitive and -insensitive functions of mTOR.
At gerosuppressive concentrations, pan-mTOR inhibitors should be tested as anti-aging drugs. Life-long administration of pan-mTOR inhibitors to mice will take several years. Yet, administration of pan-mTOR inhibitors can be started late in life, thus shortening the experiment. In fact, rapamycin is effective when started late in life in mice [9]. Optimal doses and schedules of administration could be selected by administration of pan-mTOR inhibitors to prevent obesity in mice on high fat diet (HFD). It was shown that high doses of rapamycin prevented obesity in mice on HFD even when administrated intermittently [21,98–100]. Testing anti-obesity effects of pan-mTOR inhibitors will allow investigators to determine their effective doses and schedules within several months. It would be important to test both rapamycin-like agents such as Torin 1 and rapamycin-unlike agent such as Torin 2 or AZD8085. Selected doses and schedules can then be used to extend life-span in both short-lived mice, normal and heterogeneous mice as well as mice on high fat diet. These experiments will address questions of theoretical and practical importance: (a) role of rapamycin-insensitive functions of mTOR in aging. We would learn more about aging and age-related diseases. (b) can pan-mTOR inhibitors extend life span beyond the limits achievable by rapamycin. If successful, such experiments may reveal new causes of death in the absence of mTOR-driven aging, a post-aging syndrome, as mentioned previously [101]. Given that pan-mTOR inhibitors are already undergoing clinical trials for cancer therapy, one can envision their fast application for prevention of age-related diseases by slowing down aging.
Materials and Methods
Cell lines and reagents
HT-p21 cells, derived from human fibrosarcoma HT1080, were described previously [69,76,81,102,103]. In HT-p21 cells, p21 expression can be turned on and off using IPTG (isopropyl-thio-galactosidase). These cells express GFP under CMV promoter. HT-p21 cells were cultured in DMEM/10% FC2 serum (HyClone FetaClone II; Thermo Scientific). Melanoma cell line MEL10 and breast adenocarcinoma SKBR3 (ATCC, Manassas, VA) were maintained in DMEM/10% FBS.
Rapamycin was purchased from LC Laboratories (Woburn, MA). Pan-mTOR inhibitors (torin 1, torin 2, PP242, AZD8085, KU-0063794, GSK1059615) and PD0332991 were from Selleckchem (Houston, TX). Stock solutions were prepared in DMSO.
Re-proliferative potential (RPP)
HT-p21 cells were plated at low densities and treated with IPTG alone or in combination with mTOR inhibitors as described in figure legends. After 3-4 days, IPTG and drugs were washed out and cells were allowed to re-proliferate in drug free medium for 7 days and counted in triplicates.
Immunoblot analysis
Cells were lysed using boiling lysis buffer (1% SDS, 10 mM Tris.HCl, pH7.4). Protein concentrations were measured using BCA protein reagent (Thermo Scientific) and equal amounts of protein were separated on 10% or gradient polyacrylamide gels and transferred onto PVDF membranes [69,81]. The following antibodies were used: rabbit antibodies against phospho-pS6K(T389), phospho-S6(S235/236) and phospho-S6(S240/244), S6K, phospho-4EBP1(T37/46), phospho-AKT(S473) and phospho-AKT(T308), AKT and mouse anti-S6 – from Cell Signaling Technology (Danvers, MA); mouse monoclonal antibodies against cyclin D1 and rabbit anti-actin were from Santa Cruz Biotechnology (Paso Robles, CA) and Sigma-Aldrich (St. Louis, MO), respectively.
SA-β-galactosidase staining
β-gal staining was performed using Senescence-galactosidase staining kit from Cell Signaling Technology according to manufacturer’s protocol. Cells were microphotographed under light microscope [69,73].
CLS in mammalian cells
Cells were plated at high density in 96-well plates. After 3 days, cells were trypsinized and a small aliquot of attached cells was re-plated at low density in 6-well plates in fresh medium. After 7 days in culture colonies were stained with 1% Crystal Violet (Sigma-Aldrich) [83].
Oil Red O staining
0.35% Oil Red O (Sigma-Aldrich) stock was prepared in isopropanol. Working solution was prepared fresh before use by mixing 3 parts of Oil Red O stock with 2 parts of water and incubating it at RT for 20 min followed by filtering through 0.2 µm filter. Cells were washed with PBS and incubated in 10% formalin at RT for 10 min and then with refreshed formalin for another 1 h followed by two washes in ddH2O. Fixed cells were incubated in 60% isopropanol for 5 min at RT followed by incubation with working solution of Oil Red O for 20 min. After extensive washes in ddH2O, cells were microphotographed under light microscope.
Conflicts of Interest
The authors have no conflict of interests to declare.
Funding
This work was supported by Roswell Park Cancer Institute fund.
References
-
1.
Kaeberlein M, Powers RW3rd, Steffen KK, Westman EA, Hu D, Dang N, Kerr EO, Kirkland KT, Fields S, Kennedy BK. Regulation of yeast replicative life span by TOR and Sch9 in response to nutrients. Science. 2005; 310:1193–96. https://doi.org/10.1126/science.1115535 [PubMed]
-
2.
Powers RW3rd, Kaeberlein M, Caldwell SD, Kennedy BK, Fields S. Extension of chronological life span in yeast by decreased TOR pathway signaling. Genes Dev. 2006; 20:174–84. https://doi.org/10.1101/gad.1381406 [PubMed]
-
3.
Kapahi P, Zid BM, Harper T, Koslover D, Sapin V, Benzer S. Regulation of lifespan in Drosophila by modulation of genes in the TOR signaling pathway. Curr Biol. 2004; 14:885–90. https://doi.org/10.1016/j.cub.2004.03.059 [PubMed]
-
4.
Scialò F, Sriram A, Naudí A, Ayala V, Jové M, Pamplona R, Sanz A. Target of rapamycin activation predicts lifespan in fruit flies. Cell Cycle. 2015; 14:2949–58. https://doi.org/10.1080/15384101.2015.1071745 [PubMed]
-
5.
Moskalev AA, Shaposhnikov MV. Pharmacological inhibition of phosphoinositide 3 and TOR kinases improves survival of Drosophila melanogaster. Rejuvenation Res. 2010; 13:246–47. https://doi.org/10.1089/rej.2009.0903 [PubMed]
-
6.
Bjedov I, Toivonen JM, Kerr F, Slack C, Jacobson J, Foley A, Partridge L. Mechanisms of life span extension by rapamycin in the fruit fly Drosophila melanogaster. Cell Metab. 2010; 11:35–46. https://doi.org/10.1016/j.cmet.2009.11.010 [PubMed]
-
7.
Danilov A, Shaposhnikov M, Plyusnina E, Kogan V, Fedichev P, Moskalev A. Selective anticancer agents suppress aging in Drosophila. Oncotarget. 2013; 4:1507–26. https://doi.org/10.18632/oncotarget.1272 [PubMed]
-
8.
Robida-Stubbs S, Glover-Cutter K, Lamming DW, Mizunuma M, Narasimhan SD, Neumann-Haefelin E, Sabatini DM, Blackwell TK. TOR signaling and rapamycin influence longevity by regulating SKN-1/Nrf and DAF-16/FoxO. Cell Metab. 2012; 15:713–24. https://doi.org/10.1016/j.cmet.2012.04.007 [PubMed]
-
9.
Harrison DE, Strong R, Sharp ZD, Nelson JF, Astle CM, Flurkey K, Nadon NL, Wilkinson JE, Frenkel K, Carter CS, Pahor M, Javors MA, Fernandez E, Miller RA. Rapamycin fed late in life extends lifespan in genetically heterogeneous mice. Nature. 2009; 460:392–95. [PubMed]
-
10.
Anisimov VN, Zabezhinski MA, Popovich IG, Piskunova TS, Semenchenko AV, Tyndyk ML, Yurova MN, Antoch MP, Blagosklonny MV. Rapamycin extends maximal lifespan in cancer-prone mice. Am J Pathol. 2010; 176:2092–97. https://doi.org/10.2353/ajpath.2010.091050 [PubMed]
-
11.
Anisimov VN, Zabezhinski MA, Popovich IG, Piskunova TS, Semenchenko AV, Tyndyk ML, Yurova MN, Rosenfeld SV, Blagosklonny MV. Rapamycin increases lifespan and inhibits spontaneous tumorigenesis in inbred female mice. Cell Cycle. 2011; 10:4230–36. https://doi.org/10.4161/cc.10.24.18486 [PubMed]
-
12.
Wilkinson JE, Burmeister L, Brooks SV, Chan CC, Friedline S, Harrison DE, Hejtmancik JF, Nadon N, Strong R, Wood LK, Woodward MA, Miller RA. Rapamycin slows aging in mice. Aging Cell. 2012; 11:675–82. https://doi.org/10.1111/j.1474-9726.2012.00832.x [PubMed]
-
13.
Comas M, Toshkov I, Kuropatwinski KK, Chernova OB, Polinsky A, Blagosklonny MV, Gudkov AV, Antoch MP. New nanoformulation of rapamycin Rapatar extends lifespan in homozygous p53-/- mice by delaying carcinogenesis. Aging (Albany NY). 2012; 4:715–22. https://doi.org/10.18632/aging.100496 [PubMed]
-
14.
Komarova EA, Antoch MP, Novototskaya LR, Chernova OB, Paszkiewicz G, Leontieva OV, Blagosklonny MV, Gudkov AV. Rapamycin extends lifespan and delays tumorigenesis in heterozygous p53+/- mice. Aging (Albany NY). 2012; 4:709–14. https://doi.org/10.18632/aging.100498 [PubMed]
-
15.
Ramos FJ, Chen SC, Garelick MG, Dai DF, Liao CY, Schreiber KH, MacKay VL, An EH, Strong R, Ladiges WC, Rabinovitch PS, Kaeberlein M, Kennedy BK. Rapamycin reverses elevated mTORC1 signaling in lamin A/C-deficient mice, rescues cardiac and skeletal muscle function, and extends survival. Sci Transl Med. 2012; 4:144ra103. https://doi.org/10.1126/scitranslmed.3003802 [PubMed]
-
16.
Livi CB, Hardman RL, Christy BA, Dodds SG, Jones D, Williams C, Strong R, Bokov A, Javors MA, Ikeno Y, Hubbard G, Hasty P, Sharp ZD. Rapamycin extends life span of Rb1+/- mice by inhibiting neuroendocrine tumors. Aging (Albany NY). 2013; 5:100–10. https://doi.org/10.18632/aging.100533 [PubMed]
-
17.
Miller RA, Harrison DE, Astle CM, Fernandez E, Flurkey K, Han M, Javors MA, Li X, Nadon NL, Nelson JF, Pletcher S, Salmon AB, Sharp ZD, et al. Rapamycin-mediated lifespan increase in mice is dose and sex dependent and metabolically distinct from dietary restriction. Aging Cell. 2014; 13:468–77. https://doi.org/10.1111/acel.12194 [PubMed]
-
18.
Popovich IG, Anisimov VN, Zabezhinski MA, Semenchenko AV, Tyndyk ML, Yurova MN, Blagosklonny MV. Lifespan extension and cancer prevention in HER-2/neu transgenic mice treated with low intermittent doses of rapamycin. Cancer Biol Ther. 2014; 15:586–92. https://doi.org/10.4161/cbt.28164 [PubMed]
-
19.
Zhang Y, Bokov A, Gelfond J, Soto V, Ikeno Y, Hubbard G, Diaz V, Sloane L, Maslin K, Treaster S, Réndon S, van Remmen H, Ward W, et al. Rapamycin extends life and health in C57BL/6 mice. J Gerontol A Biol Sci Med Sci. 2014; 69:119–30. https://doi.org/10.1093/gerona/glt056 [PubMed]
-
20.
Fok WC, Chen Y, Bokov A, Zhang Y, Salmon AB, Diaz V, Javors M, Wood WH3rd, Zhang Y, Becker KG, Pérez VI, Richardson A. Mice fed rapamycin have an increase in lifespan associated with major changes in the liver transcriptome. PLoS One. 2014; 9:e83988. https://doi.org/10.1371/journal.pone.0083988 [PubMed]
-
21.
Leontieva OV, Paszkiewicz GM, Blagosklonny MV. Weekly administration of rapamycin improves survival and biomarkers in obese male mice on high-fat diet. Aging Cell. 2014; 13:616–22. https://doi.org/10.1111/acel.12211 [PubMed]
-
22.
Hasty P, Livi CB, Dodds SG, Jones D, Strong R, Javors M, Fischer KE, Sloane L, Murthy K, Hubbard G, Sun L, Hurez V, Curiel TJ, Sharp ZD. eRapa restores a normal life span in a FAP mouse model. Cancer Prev Res (Phila). 2014; 7:169–78. https://doi.org/10.1158/1940-6207.CAPR-13-0299 [PubMed]
-
23.
Fischer KE, Gelfond JA, Soto VY, Han C, Someya S, Richardson A, Austad SN. Health Effects of Long-Term Rapamycin Treatment: The Impact on Mouse Health of Enteric Rapamycin Treatment from Four Months of Age throughout Life. PLoS One. 2015; 10:e0126644. https://doi.org/10.1371/journal.pone.0126644 [PubMed]
-
24.
Ye L, Widlund AL, Sims CA, Lamming DW, Guan Y, Davis JG, Sabatini DM, Harrison DE, Vang O, Baur JA. Rapamycin doses sufficient to extend lifespan do not compromise muscle mitochondrial content or endurance. Aging (Albany NY). 2013; 5:539–50. https://doi.org/10.18632/aging.100576 [PubMed]
-
25.
Johnson SC, Rabinovitch PS, Kaeberlein M. mTOR is a key modulator of ageing and age-related disease. Nature. 2013; 493:338–45. https://doi.org/10.1038/nature11861 [PubMed]
-
26.
Johnson SC, Yanos ME, Kayser EB, Quintana A, Sangesland M, Castanza A, Uhde L, Hui J, Wall VZ, Gagnidze A, Oh K, Wasko BM, Ramos FJ, et al. mTOR inhibition alleviates mitochondrial disease in a mouse model of Leigh syndrome. Science. 2013; 342:1524–28. https://doi.org/10.1126/science.1244360 [PubMed]
-
27.
Fang Y, Bartke A. Prolonged rapamycin treatment led to beneficial metabolic switch. Aging (Albany NY). 2013; 5:328–29. https://doi.org/10.18632/aging.100554 [PubMed]
-
28.
Spong A, Bartke A. Rapamycin slows aging in mice. Cell Cycle. 2012; 11:845. https://doi.org/10.4161/cc.11.5.19607 [PubMed]
-
29.
Blagosklonny MV. Rapamycin extends life- and health span because it slows aging. Aging (Albany NY). 2013; 5:592–98. https://doi.org/10.18632/aging.100591 [PubMed]
-
30.
Hurez V, Dao V, Liu A, Pandeswara S, Gelfond J, Sun L, Bergman M, Orihuela CJ, Galvan V, Padrón Á, Drerup J, Liu Y, Hasty P, et al. Chronic mTOR inhibition in mice with rapamycin alters T, B, myeloid, and innate lymphoid cells and gut flora and prolongs life of immune-deficient mice. Aging Cell. 2015; 14:945–56. https://doi.org/10.1111/acel.12380 [PubMed]
-
31.
Verlingue L, Dugourd A, Stoll G, Barillot E, Calzone L, Londoño-Vallejo A. A comprehensive approach to the molecular determinants of lifespan using a Boolean model of geroconversion. Aging Cell. 2016; 15:1018–26. https://doi.org/10.1111/acel.12504 [PubMed]
-
32.
Stanfel MN, Shamieh LS, Kaeberlein M, Kennedy BK. The TOR pathway comes of age. Biochim Biophys Acta. 2009; 1790:1067–74. https://doi.org/10.1016/j.bbagen.2009.06.007 [PubMed]
-
33.
Campistol JM, Eris J, Oberbauer R, Friend P, Hutchison B, Morales JM, Claesson K, Stallone G, Russ G, Rostaing L, Kreis H, Burke JT, Brault Y, et al. Sirolimus therapy after early cyclosporine withdrawal reduces the risk for cancer in adult renal transplantation. J Am Soc Nephrol. 2006; 17:581–89. https://doi.org/10.1681/ASN.2005090993 [PubMed]
-
34.
Kauffman HM, Cherikh WS, Cheng Y, Hanto DW, Kahan BD. Maintenance immunosuppression with target-of-rapamycin inhibitors is associated with a reduced incidence of de novo malignancies. Transplantation. 2005; 80:883–89. https://doi.org/10.1097/01.TP.0000184006.43152.8D [PubMed]
-
35.
Euvrard S, Morelon E, Rostaing L, Goffin E, Brocard A, Tromme I, Broeders N, del Marmol V, Chatelet V, Dompmartin A, Kessler M, Serra AL, Hofbauer GF, et al, and TUMORAPA Study Group. Sirolimus and secondary skin-cancer prevention in kidney transplantation. N Engl J Med. 2012; 367:329–39. https://doi.org/10.1056/NEJMoa1204166 [PubMed]
-
36.
Bravo-San Pedro JM, Senovilla L. Immunostimulatory activity of lifespan-extending agents. Aging (Albany NY). 2013; 5:793–801. https://doi.org/10.18632/aging.100619 [PubMed]
-
37.
Mannick JB, Del Giudice G, Lattanzi M, Valiante NM, Praestgaard J, Huang B, Lonetto MA, Maecker HT, Kovarik J, Carson S, Glass DJ, Klickstein LB. mTOR inhibition improves immune function in the elderly. Sci Transl Med. 2014; 6:268ra179. https://doi.org/10.1126/scitranslmed.3009892 [PubMed]
-
38.
Kennedy BK, Pennypacker JK. Aging interventions get human. Oncotarget. 2015; 6:590–91. https://doi.org/10.18632/oncotarget.3173 [PubMed]
-
39.
Blagosklonny MV. Rejuvenating immunity: “anti-aging drug today” eight years later. Oncotarget. 2015; 6:19405–12. https://doi.org/10.18632/oncotarget.3740 [PubMed]
-
40.
Ross C, Salmon A, Strong R, Fernandez E, Javors M, Richardson A, Tardif S. Metabolic consequences of long-term rapamycin exposure on common marmoset monkeys (Callithrix jacchus). Aging (Albany NY). 2015; 7:964–73. https://doi.org/10.18632/aging.100843 [PubMed]
-
41.
Fan X, Liang Q, Lian T, Wu Q, Gaur U, Li D, Yang D, Mao X, Jin Z, Li Y, Yang M. Rapamycin preserves gut homeostasis during Drosophila aging. Oncotarget. 2015; 6:35274–83. [PubMed]
-
42.
Johnson SC, Yanos ME, Bitto A, Castanza A, Gagnidze A, Gonzalez B, Gupta K, Hui J, Jarvie C, Johnson BM, Letexier N, McCanta L, Sangesland M, et al. Dose-dependent effects of mTOR inhibition on weight and mitochondrial disease in mice. Front Genet. 2015; 6:247. https://doi.org/10.3389/fgene.2015.00247 [PubMed]
-
43.
Zaseck LW, Miller RA, Brooks SV. Rapamycin Attenuates Age-associated Changes in Tibialis Anterior Tendon Viscoelastic Properties. J Gerontol A Biol Sci Med Sci. 2016; 71:858–65. https://doi.org/10.1093/gerona/glv307 [PubMed]
-
44.
Xue QL, Yang H, Li HF, Abadir PM, Burks TN, Koch LG, Britton SL, Carlson J, Chen L, Walston JD, Leng SX. Rapamycin increases grip strength and attenuates age-related decline in maximal running distance in old low capacity runner rats. Aging (Albany NY). 2016; 8:769–76. https://doi.org/10.18632/aging.100929 [PubMed]
-
45.
Bitto A, Ito TK, Pineda VV, LeTexier NJ, Huang HZ, Sutlief E, Tung H, Vizzini N, Chen B, Smith K, Meza D, Yajima M, Beyer RP, et al. Transient rapamycin treatment can increase lifespan and healthspan in middle-aged mice. eLife. 2016; 5:e16351. https://doi.org/10.7554/eLife.16351 [PubMed]
-
46.
Lelegren M, Liu Y, Ross C, Tardif S, Salmon AB. Pharmaceutical inhibition of mTOR in the common marmoset: effect of rapamycin on regulators of proteostasis in a non-human primate. Pathobiol Aging Age Relat Dis. 2016; 6:31793. https://doi.org/10.3402/pba.v6.31793 [PubMed]
-
47.
Halloran J, Hussong SA, Burbank R, Podlutskaya N, Fischer KE, Sloane LB, Austad SN, Strong R, Richardson A, Hart MJ, Galvan V. Chronic inhibition of mammalian target of rapamycin by rapamycin modulates cognitive and non-cognitive components of behavior throughout lifespan in mice. Neuroscience. 2012; 223:102–13. https://doi.org/10.1016/j.neuroscience.2012.06.054 [PubMed]
-
48.
Lesovaya EA, Kirsanov KI, Antoshina EE, Trukhanova LS, Gorkova TG, Shipaeva EV, Salimov RM, Belitsky GA, Blagosklonny MV, Yakubovskaya MG, Chernova OB. Rapatar, a nanoformulation of rapamycin, decreases chemically-induced benign prostate hyperplasia in rats. Oncotarget. 2015; 6:9718–27. https://doi.org/10.18632/oncotarget.3929 [PubMed]
-
49.
Kaeberlein M. Rapamycin and ageing: when, for how long, and how much? J Genet Genomics. 2014; 41:459–63. https://doi.org/10.1016/j.jgg.2014.06.009 [PubMed]
-
50.
Tuhácková Z, Sovová V, Sloncová E, Proud CG. Rapamycin-resistant phosphorylation of the initiation factor-4E-binding protein (4E-BP1) in v-SRC-transformed hamster fibroblasts. Int J Cancer. 1999; 81:963–69. https://doi.org/10.1002/(SICI)1097-0215(19990611)81:6<963::AID-IJC20>3.0.CO;2-C [PubMed]
-
51.
Diggle TA, Moule SK, Avison MB, Flynn A, Foulstone EJ, Proud CG, Denton RM. Both rapamycin-sensitive and -insensitive pathways are involved in the phosphorylation of the initiation factor-4E-binding protein (4E-BP1) in response to insulin in rat epididymal fat-cells. Biochem J. 1996; 316:447–53. https://doi.org/10.1042/bj3160447 [PubMed]
-
52.
Choo AY, Yoon SO, Kim SG, Roux PP, Blenis J. Rapamycin differentially inhibits S6Ks and 4E-BP1 to mediate cell-type-specific repression of mRNA translation. Proc Natl Acad Sci USA. 2008; 105:17414–19. https://doi.org/10.1073/pnas.0809136105 [PubMed]
-
53.
Choo AY, Blenis J. Not all substrates are treated equally: implications for mTOR, rapamycin-resistance and cancer therapy. Cell Cycle. 2009; 8:567–72. https://doi.org/10.4161/cc.8.4.7659 [PubMed]
-
54.
Kang SA, Pacold ME, Cervantes CL, Lim D, Lou HJ, Ottina K, Gray NS, Turk BE, Yaffe MB, Sabatini DM. mTORC1 phosphorylation sites encode their sensitivity to starvation and rapamycin. Science. 2013; 341:1236566. https://doi.org/10.1126/science.1236566 [PubMed]
-
55.
Liu Y, Vertommen D, Rider MH, Lai YC. Mammalian target of rapamycin-independent S6K1 and 4E-BP1 phosphorylation during contraction in rat skeletal muscle. Cell Signal. 2013; 25:1877–86. https://doi.org/10.1016/j.cellsig.2013.05.005 [PubMed]
-
56.
Thoreen CC, Kang SA, Chang JW, Liu Q, Zhang J, Gao Y, Reichling LJ, Sim T, Sabatini DM, Gray NS. An ATP-competitive mammalian target of rapamycin inhibitor reveals rapamycin-resistant functions of mTORC1. J Biol Chem. 2009; 284:8023–32. https://doi.org/10.1074/jbc.M900301200 [PubMed]
-
57.
Yellen P, Saqcena M, Salloum D, Feng J, Preda A, Xu L, Rodrik-Outmezguine V, Foster DA. High-dose rapamycin induces apoptosis in human cancer cells by dissociating mTOR complex 1 and suppressing phosphorylation of 4E-BP1. Cell Cycle. 2011; 10:3948–56. https://doi.org/10.4161/cc.10.22.18124 [PubMed]
-
58.
Jiang YP, Ballou LM, Lin RZ. Rapamycin-insensitive regulation of 4e-BP1 in regenerating rat liver. J Biol Chem. 2001; 276:10943–51. https://doi.org/10.1074/jbc.M007758200 [PubMed]
-
59.
Benjamin D, Colombi M, Moroni C, Hall MN. Rapamycin passes the torch: a new generation of mTOR inhibitors. Nat Rev Drug Discov. 2011; 10:868–80. https://doi.org/10.1038/nrd3531 [PubMed]
-
60.
Hassan B, Akcakanat A, Sangai T, Evans KW, Adkins F, Eterovic AK, Zhao H, Chen K, Chen H, Do KA, Xie SM, Holder AM, Naing A, et al. Catalytic mTOR inhibitors can overcome intrinsic and acquired resistance to allosteric mTOR inhibitors. Oncotarget. 2014; 5:8544–57. https://doi.org/10.18632/oncotarget.2337 [PubMed]
-
61.
Jacinto E, Loewith R, Schmidt A, Lin S, Rüegg MA, Hall A, Hall MN. Mammalian TOR complex 2 controls the actin cytoskeleton and is rapamycin insensitive. Nat Cell Biol. 2004; 6:1122–28. https://doi.org/10.1038/ncb1183 [PubMed]
-
62.
Markman B, Dienstmann R, Tabernero J. Targeting the PI3K/Akt/mTOR pathway--beyond rapalogs. Oncotarget. 2010; 1:530–43. https://doi.org/10.18632/oncotarget.188 [PubMed]
-
63.
Chresta CM, Davies BR, Hickson I, Harding T, Cosulich S, Critchlow SE, Vincent JP, Ellston R, Jones D, Sini P, James D, Howard Z, Dudley P, et al. AZD8055 is a potent, selective, and orally bioavailable ATP-competitive mammalian target of rapamycin kinase inhibitor with in vitro and in vivo antitumor activity. Cancer Res. 2010; 70:288–98. https://doi.org/10.1158/0008-5472.CAN-09-1751 [PubMed]
-
64.
Guo Y, Kwiatkowski DJ. Equivalent benefit of rapamycin and a potent mTOR ATP-competitive inhibitor, MLN0128 (INK128), in a mouse model of tuberous sclerosis. Mol Cancer Res. 2013; 11:467–73. https://doi.org/10.1158/1541-7786.MCR-12-0605 [PubMed]
-
65.
Yu K, Toral-Barza L, Shi C, Zhang WG, Lucas J, Shor B, Kim J, Verheijen J, Curran K, Malwitz DJ, Cole DC, Ellingboe J, Ayral-Kaloustian S, et al. Biochemical, cellular, and in vivo activity of novel ATP-competitive and selective inhibitors of the mammalian target of rapamycin. Cancer Res. 2009; 69:6232–40. https://doi.org/10.1158/0008-5472.CAN-09-0299 [PubMed]
-
66.
Blagosklonny MV. Cell cycle arrest is not yet senescence, which is not just cell cycle arrest: terminology for TOR-driven aging. Aging (Albany NY). 2012; 4:159–65. https://doi.org/10.18632/aging.100443 [PubMed]
-
67.
Blagosklonny MV. Geroconversion: irreversible step to cellular senescence. Cell Cycle. 2014; 13:3628–35. https://doi.org/10.4161/15384101.2014.985507 [PubMed]
-
68.
Demidenko ZN, Korotchkina LG, Gudkov AV, Blagosklonny MV. Paradoxical suppression of cellular senescence by p53. Proc Natl Acad Sci USA. 2010; 107:9660–64. https://doi.org/10.1073/pnas.1002298107 [PubMed]
-
69.
Leontieva OV, Natarajan V, Demidenko ZN, Burdelya LG, Gudkov AV, Blagosklonny MV. Hypoxia suppresses conversion from proliferative arrest to cellular senescence. Proc Natl Acad Sci USA. 2012; 109:13314–18. https://doi.org/10.1073/pnas.1205690109 [PubMed]
-
70.
Leontieva OV, Demidenko ZN, Blagosklonny MV. S6K in geroconversion. Cell Cycle. 2013; 12:3249–52. https://doi.org/10.4161/cc.26248 [PubMed]
-
71.
Leontieva OV, Blagosklonny MV. CDK4/6-inhibiting drug substitutes for p21 and p16 in senescence: duration of cell cycle arrest and MTOR activity determine geroconversion. Cell Cycle. 2013; 12:3063–69. https://doi.org/10.4161/cc.26130 [PubMed]
-
72.
Leontieva OV, Blagosklonny MV. Tumor promoter-induced cellular senescence: cell cycle arrest followed by geroconversion. Oncotarget. 2014; 5:12715–27. https://doi.org/10.18632/oncotarget.3011 [PubMed]
-
73.
Leontieva OV, Demidenko ZN, Blagosklonny MV. Contact inhibition and high cell density deactivate the mammalian target of rapamycin pathway, thus suppressing the senescence program. Proc Natl Acad Sci USA. 2014; 111:8832–37. https://doi.org/10.1073/pnas.1405723111 [PubMed]
-
74.
Zhao H, Halicka HD, Li J, Darzynkiewicz Z. Berberine suppresses gero-conversion from cell cycle arrest to senescence. Aging (Albany NY). 2013; 5:623–36. https://doi.org/10.18632/aging.100593 [PubMed]
-
75.
Sousa-Victor P, Gutarra S, García-Prat L, Rodriguez-Ubreva J, Ortet L, Ruiz-Bonilla V, Jardí M, Ballestar E, González S, Serrano AL, Perdiguero E, Muñoz-Cánoves P. Geriatric muscle stem cells switch reversible quiescence into senescence. Nature. 2014; 506:316–21. https://doi.org/10.1038/nature13013 [PubMed]
-
76.
Demidenko ZN, Blagosklonny MV. Growth stimulation leads to cellular senescence when the cell cycle is blocked. Cell Cycle. 2008; 7:3355–61. https://doi.org/10.4161/cc.7.21.6919 [PubMed]
-
77.
Demidenko ZN, Zubova SG, Bukreeva EI, Pospelov VA, Pospelova TV, Blagosklonny MV. Rapamycin decelerates cellular senescence. Cell Cycle. 2009; 8:1888–95. https://doi.org/10.4161/cc.8.12.8606 [PubMed]
-
78.
Leontieva OV, Demidenko ZN, Blagosklonny MV. Dual mTORC1/C2 inhibitors suppress cellular geroconversion (a senescence program). Oncotarget. 2015; 6:23238–48. https://doi.org/10.18632/oncotarget.4836 [PubMed]
-
79.
Sousa-Victor P, García-Prat L, Muñoz-Cánoves P. Dual mTORC1/C2 inhibitors: gerosuppressors with potential anti-aging effect. Oncotarget. 2015; 6:23052–54. https://doi.org/10.18632/oncotarget.5563 [PubMed]
-
80.
Walters HE, Deneka-Hannemann S, Cox LS. Reversal of phenotypes of cellular senescence by pan-mTOR inhibition. Aging (Albany NY). 2016; 8:231–44. https://doi.org/10.18632/aging.100872 [PubMed]
-
81.
Leontieva OV, Lenzo F, Demidenko ZN, Blagosklonny MV. Hyper-mitogenic drive coexists with mitotic incompetence in senescent cells. Cell Cycle. 2012; 11:4642–49. https://doi.org/10.4161/cc.22937 [PubMed]
-
82.
Demidenko ZN, Blagosklonny MV. Quantifying pharmacologic suppression of cellular senescence: prevention of cellular hypertrophy versus preservation of proliferative potential. Aging (Albany NY). 2009; 1:1008–16. https://doi.org/10.18632/aging.100115 [PubMed]
-
83.
Leontieva OV, Blagosklonny MV. Yeast-like chronological senescence in mammalian cells: phenomenon, mechanism and pharmacological suppression. Aging (Albany NY). 2011; 3:1078–91. https://doi.org/10.18632/aging.100402 [PubMed]
-
84.
Leontieva OV, Blagosklonny MV. M(o)TOR of pseudo-hypoxic state in aging: rapamycin to the rescue. Cell Cycle. 2014; 13:509–15. https://doi.org/10.4161/cc.27973 [PubMed]
-
85.
Blagosklonny MV. Aging and immortality: quasi-programmed senescence and its pharmacologic inhibition. Cell Cycle. 2006; 5:2087–102. https://doi.org/10.4161/cc.5.18.3288 [PubMed]
-
86.
Blagosklonny MV. An anti-aging drug today: from senescence-promoting genes to anti-aging pill. Drug Discov Today. 2007; 12:218–24. https://doi.org/10.1016/j.drudis.2007.01.004 [PubMed]
-
87.
Blagosklonny MV. Paradoxes of aging. Cell Cycle. 2007; 6:2997–3003. https://doi.org/10.4161/cc.6.24.5124 [PubMed]
-
88.
Blagosklonny MV. Aging: ROS or TOR. Cell Cycle. 2008; 7:3344–54. https://doi.org/10.4161/cc.7.21.6965 [PubMed]
-
89.
Blagosklonny MV. Validation of anti-aging drugs by treating age-related diseases. Aging (Albany NY). 2009; 1:281–88. https://doi.org/10.18632/aging.100034 [PubMed]
-
90.
Blagosklonny MV, Hall MN. Growth and aging: a common molecular mechanism. Aging (Albany NY). 2009; 1:357–62. https://doi.org/10.18632/aging.100040 [PubMed]
-
91.
Blagosklonny MV. Calorie restriction: decelerating mTOR-driven aging from cells to organisms (including humans). Cell Cycle. 2010; 9:683–88. https://doi.org/10.4161/cc.9.4.10766 [PubMed]
-
92.
Blagosklonny MV. Rapamycin and quasi-programmed aging: four years later. Cell Cycle. 2010; 9:1859–62. https://doi.org/10.4161/cc.9.10.11872 [PubMed]
-
93.
Blagosklonny MV. Answering the ultimate question “what is the proximal cause of aging?”. Aging (Albany NY). 2012; 4:861–77. https://doi.org/10.18632/aging.100525 [PubMed]
-
94.
Blagosklonny MV. Aging is not programmed: genetic pseudo-program is a shadow of developmental growth. Cell Cycle. 2013; 12:3736–42. https://doi.org/10.4161/cc.27188 [PubMed]
-
95.
Gems D, de la Guardia Y. Alternative Perspectives on Aging in Caenorhabditis elegans: Reactive Oxygen Species or Hyperfunction? Antioxid Redox Signal. 2013; 19:321–29. https://doi.org/10.1089/ars.2012.4840 [PubMed]
-
96.
Gems D, Partridge L. Genetics of longevity in model organisms: debates and paradigm shifts. Annu Rev Physiol. 2013; 75:621–44. https://doi.org/10.1146/annurev-physiol-030212-183712 [PubMed]
-
97.
Stipp D. A new path to longevity. Sci Am. 2012; 306:32–39. https://doi.org/10.1038/scientificamerican0112-32 [PubMed]
-
98.
Chang GR, Chiu YS, Wu YY, Chen WY, Liao JW, Chao TH, Mao FC. Rapamycin protects against high fat diet-induced obesity in C57BL/6J mice. J Pharmacol Sci. 2009; 109:496–503. https://doi.org/10.1254/jphs.08215FP [PubMed]
-
99.
Leontieva OV, Paszkiewicz GM, Blagosklonny MV. Comparison of rapamycin schedules in mice on high-fat diet. Cell Cycle. 2014; 13:3350–56. https://doi.org/10.4161/15384101.2014.970491 [PubMed]
-
100.
Makki K, Taront S, Molendi-Coste O, Bouchaert E, Neve B, Eury E, Lobbens S, Labalette M, Duez H, Staels B, Dombrowicz D, Froguel P, Wolowczuk I. Beneficial metabolic effects of rapamycin are associated with enhanced regulatory cells in diet-induced obese mice. PLoS One. 2014; 9:e92684. https://doi.org/10.1371/journal.pone.0092684 [PubMed]
-
101.
Blagosklonny MV. Koschei the immortal and anti-aging drugs. Cell Death Dis. 2014; 5:e1552. https://doi.org/10.1038/cddis.2014.520 [PubMed]
-
102.
Chang BD, Broude EV, Fang J, Kalinichenko TV, Abdryashitov R, Poole JC, Roninson IB. p21Waf1/Cip1/Sdi1-induced growth arrest is associated with depletion of mitosis-control proteins and leads to abnormal mitosis and endoreduplication in recovering cells. Oncogene. 2000; 19:2165–70. https://doi.org/10.1038/sj.onc.1203573 [PubMed]
-
103.
Broude EV, Swift ME, Vivo C, Chang BD, Davis BM, Kalurupalle S, Blagosklonny MV, Roninson IB. p21(Waf1/Cip1/Sdi1) mediates retinoblastoma protein degradation. Oncogene. 2007; 26:6954–58. https://doi.org/10.1038/sj.onc.1210516 [PubMed]