CD56neg NK cells with impaired effector function expand in CMV / EBV co-infected hosts >60 years of age
The imprint of chronic viral infections on immunity is most pronounced during later stages of life. To study the impact of CMV infection on NK cell immunity during aging we first determined frequencies of NK cell subsets in 20 young (<35 years (median 31 years, range 25-34 years)) and 41 elderly (>60 years (median 64 years, range 62-70 years)) donors stratified according to CMV serostatus. Intriguingly, CMV infection in healthy donors >60 years of age was associated with a distinct increase in the frequency of CD56neg and a decrease in CD56dim NK cells (Figure 1A). In contrast, young CMV-positive donors had less CD56bright NK cells but an increased proportion of CD56dim cells (Figure 1A). No changes in the frequency of CD56neg NK cells were seen in young CMV-positive donors (Figure 1A) – in line with 2 previous reports [31,32]. To delineate the relative contribution of CMV vs. EBV infection to the observed increase in CD56neg NK cells, we next divided the cohort of elderly donors into CMV–EBV– (n=11), EBV-positive (CMV–EBV+, n=24), CMV-positive (CMV+EBV–, n=6) and CMV+EBV+ (n=14) donors [33]. NK cells were identified in total PBMCs by gating on CD3– and CD7+ positive lymphocytes [26], then divided into three subsets based on their CD56 and CD16 expression: CD56bright (CD56++CD16–), CD56dim (CD56+CD16++), and CD56neg (CD56–CD16++) NK cells (Supplementary Figure 1A). When comparing NK cell subsets between cohort subgroups stratified according to CMV and EBV serostatus, we found a significant increase in frequency (Figure 1B, Supplementary Figure 1B) and absolute cell numbers (Figure 1C) of CD56neg NK cells in CMV+EBV+ individuals only, although the low sample number in the CMV+EBV– subgroup poses some limitation to this conclusion. Expansion of CD56neg NK cells in CMV+EBV+ donors was accompanied by a reduction in CD56dim NK cell numbers compared to CMV+ donors without EBV infection (Figure 1C).
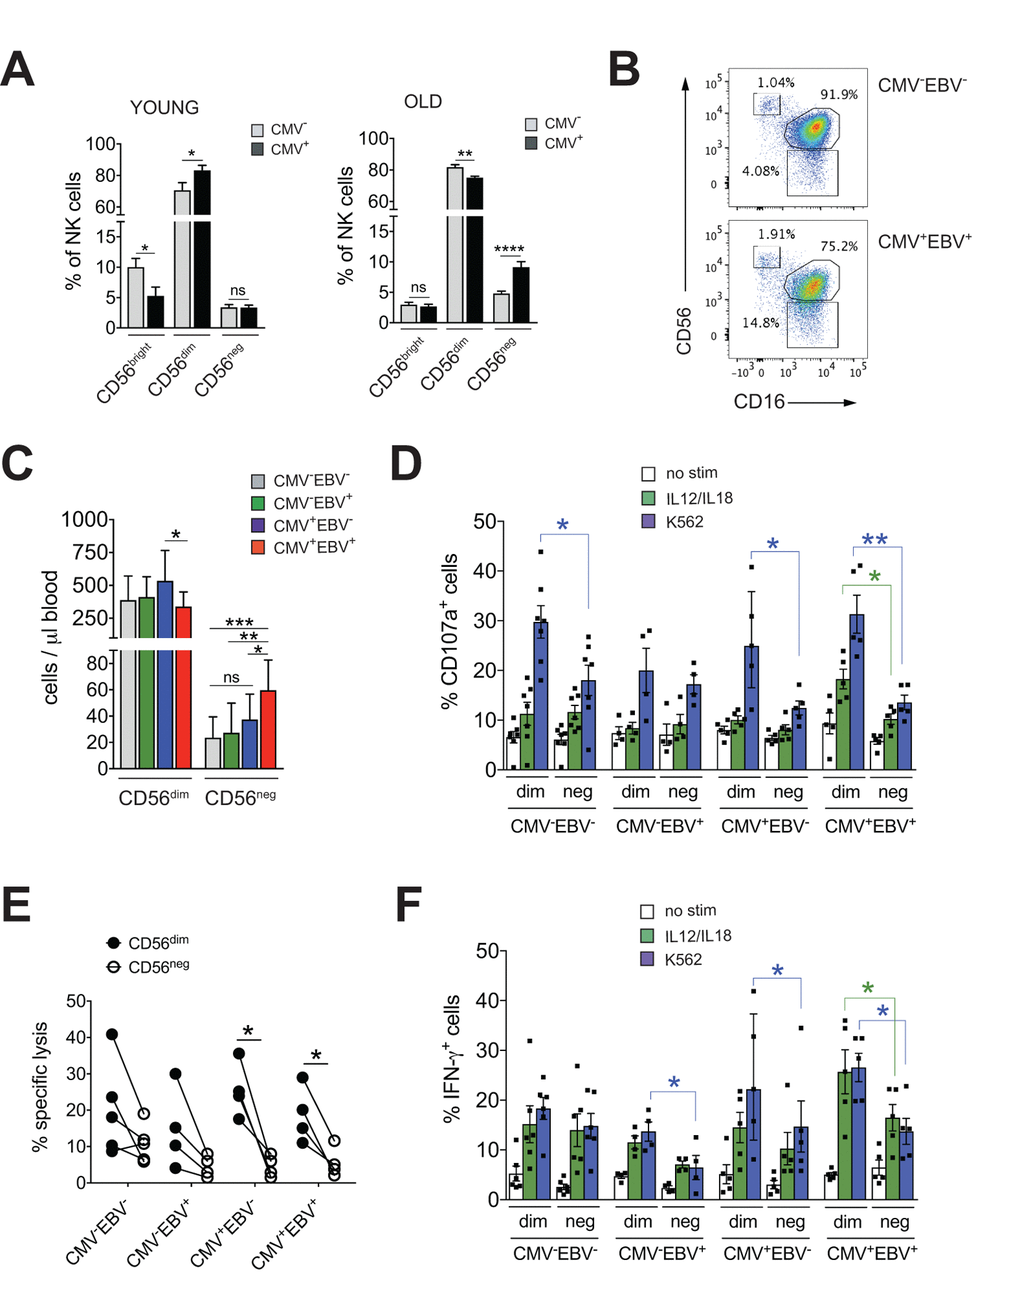
Figure 1. CD56neg NK cells with impaired effector function expand in CMV and EBV co-infected individuals >60 years of age. (A) Frequencies of CD56bright, CD56dim and CD56neg NK cells in YOUNG (<35 years) CMV– (gray bars, n=10/10) and CMV+ (black bars, n=10/10) individuals compared to OLD (>60 years) CMV- (gray bars, n=20/21) and CMV+ (black bars, n=17/20) donors analyzed as in Supplementary Figure S1A. (B) Representative FACS dot plots from a CMV–EBV– and a CMV+EBV+ donor are shown. Numbers indicate the percentage of cells within total NK cells in peripheral blood. (C) Absolute cell numbers for CD56dim and CD56neg NK cells – as determined by FACS analysis in total PBMCs– are shown in a cohort of HDs >60 years of age stratified as CMV–EBV– (n=11/11), CMV–EBV+ (n=10/24), CMV+EBV– (n=6/6), and CMV+EBV+ (n=12/14). (D-F) FACS-sorted CD56dim and CD56neg NK cells from CMV–EBV– (n=7), CMV–EBV+ (n=4), CMV+EBV- (n=4) and CMV+EBV+ (n=5) donors were either left un-stimulated (empty bars), stimulated with IL-12 / IL-18 (green bars) or K562 target cells (blue bars) and (D) CD107a expression (E) target cell lysis and (F) IFN-γ production were assessed after 6 hours of (co-)culture. Parametric data were compared by Student’s t-test and are shown as mean ± SEM, non-parametric data by Mann-Whitney test and are shown as median ± IQR, respectively. * p≤0.05, ** p≤0.005, *** p≤0.005.
CD56neg NK cells with reduced cytotoxic function have been described in chronic HIV and HCV infection [15–21]. Aiming to investigate effector functions of CD56neg NK cells in CMV and EBV co-infected donors, we FACS-sorted CD56neg and CD56dim NK cells from all 4 cohort subgroups stratified according to CMV and EBV serostatus as described above. We then assessed expression of CD107a and production of IFN-γ in response to stimulation with K562 target cells, IL-12 / IL-18 (Figure 1D, F) and the killing capacity toward K562 target cells (Figure 1E). We found a significant decrease in CD107a expression in CD56neg NK cells compared to CD56dim cells in CMV–EBV– (n=7) and CMV+EBV– (n=6) donors, and an even more pronounced decrease in CD107a in CD56neg NK cells from CMV+EBV+ (n=5) donors (Figure 1D). Moreover, in CMV+EBV+ individuals CD107a expression was decreased in response to both target cell and cytokine stimulation in the CD56neg cell subset (Figure 1D). We then tested killing capacity of sorted CD56dim and CD56neg NK cells from all 4 cohort subgroups by measuring lysis of K562 target cells, a more direct measure of cytotoxic capacity. In co-culture with K562 target cells, CD56neg NK cells from CMV+EBV– and CMV+EBV+ donors had a significantly lower killing capacity than CD56dim NK cells from the same donor (Figure 1E). Analogous to the expression of CD107a, production of IFN-γ was significantly lower in CD56neg as compared to CD56dim NK cells in CMV–EBV+(n=4), CMV+EBV– (n=5) and CMV+EBV+ (n=5) donors after stimulation with K562 target cells (Figure 1F). In response to IL-12 / IL-18 stimulation, only CMV+EBV+ donors showed a significant reduction in IFN-γ production (Figure 1F). Intriguingly, CD56dim NK cells from CMV-positive donors had a significantly higher capacity to secrete IFN-γ than those from CMV-negative individuals (Figure 1F). These data are in line with previous reports that established a role for CMV in shaping immune reactivity of CD56dim NK cells both in vitro and in vivo [34,35], a phenomenon that was not recapitulated in the CD56neg NK cell subset (Figure 1F). In all, our data suggested that CD56neg NK cells had reduced cytotoxic capacity and IFN-γ production compared to CD56dim NK cells, a feature that was further pronounced in the context of CMV / EBV co-infection.
Frequencies of CD56neg NK cells in donors >60 years of age correlate with the immune risk profile
CMV infection has been associated with significant changes in T cell subset distribution with age. Population-based studies, pioneered by the Swedish longitudinal OCTO immune study, established an immune risk profile (IRP) characterized by CMV positivity, an inversed CD4 / CD8 T cell ratio and accumulation of end-differentiated T cells with poor proliferative capacity – an immunologic imprint that has been associated with a higher 2-year-mortaliity rate in healthy donors >60 years of age [6]. We next analyzed whether an increase in CD56neg NK cells may be associated with the IRP. To this end, we performed phenotypic analysis of CD4+ and CD8+ T cells classified as naïve (N; CD27+, CD45RA+), central memory (CM; CD27+, CD45RA–), effector memory (EM; CD27–, CD45RA–) and terminally-differentiated effector memory (EMRA; CD27–, CD45RA+) T cells, and determined the number of double negative (DN; CD27–CD28–) T cells [36,37] in all 4 subgroups of the cohort (Supplementary Figure S1A). Indeed, frequencies of CD56neg NK cells correlated with the percentage of end-differentiated T cells, specifically CD8+ EMRA and CD27–CD28– T cells, and a reduced CD4 / CD8 T cell ratio (Figure 2A). When stratified to CMV and EBV serostatus, only donors that were either CMV- or EBV-positive (or both) showed a positive correlation between the frequency of CD56neg NK and CD8+ EMRA T cells (Supplementary Figure S2A, left panel).
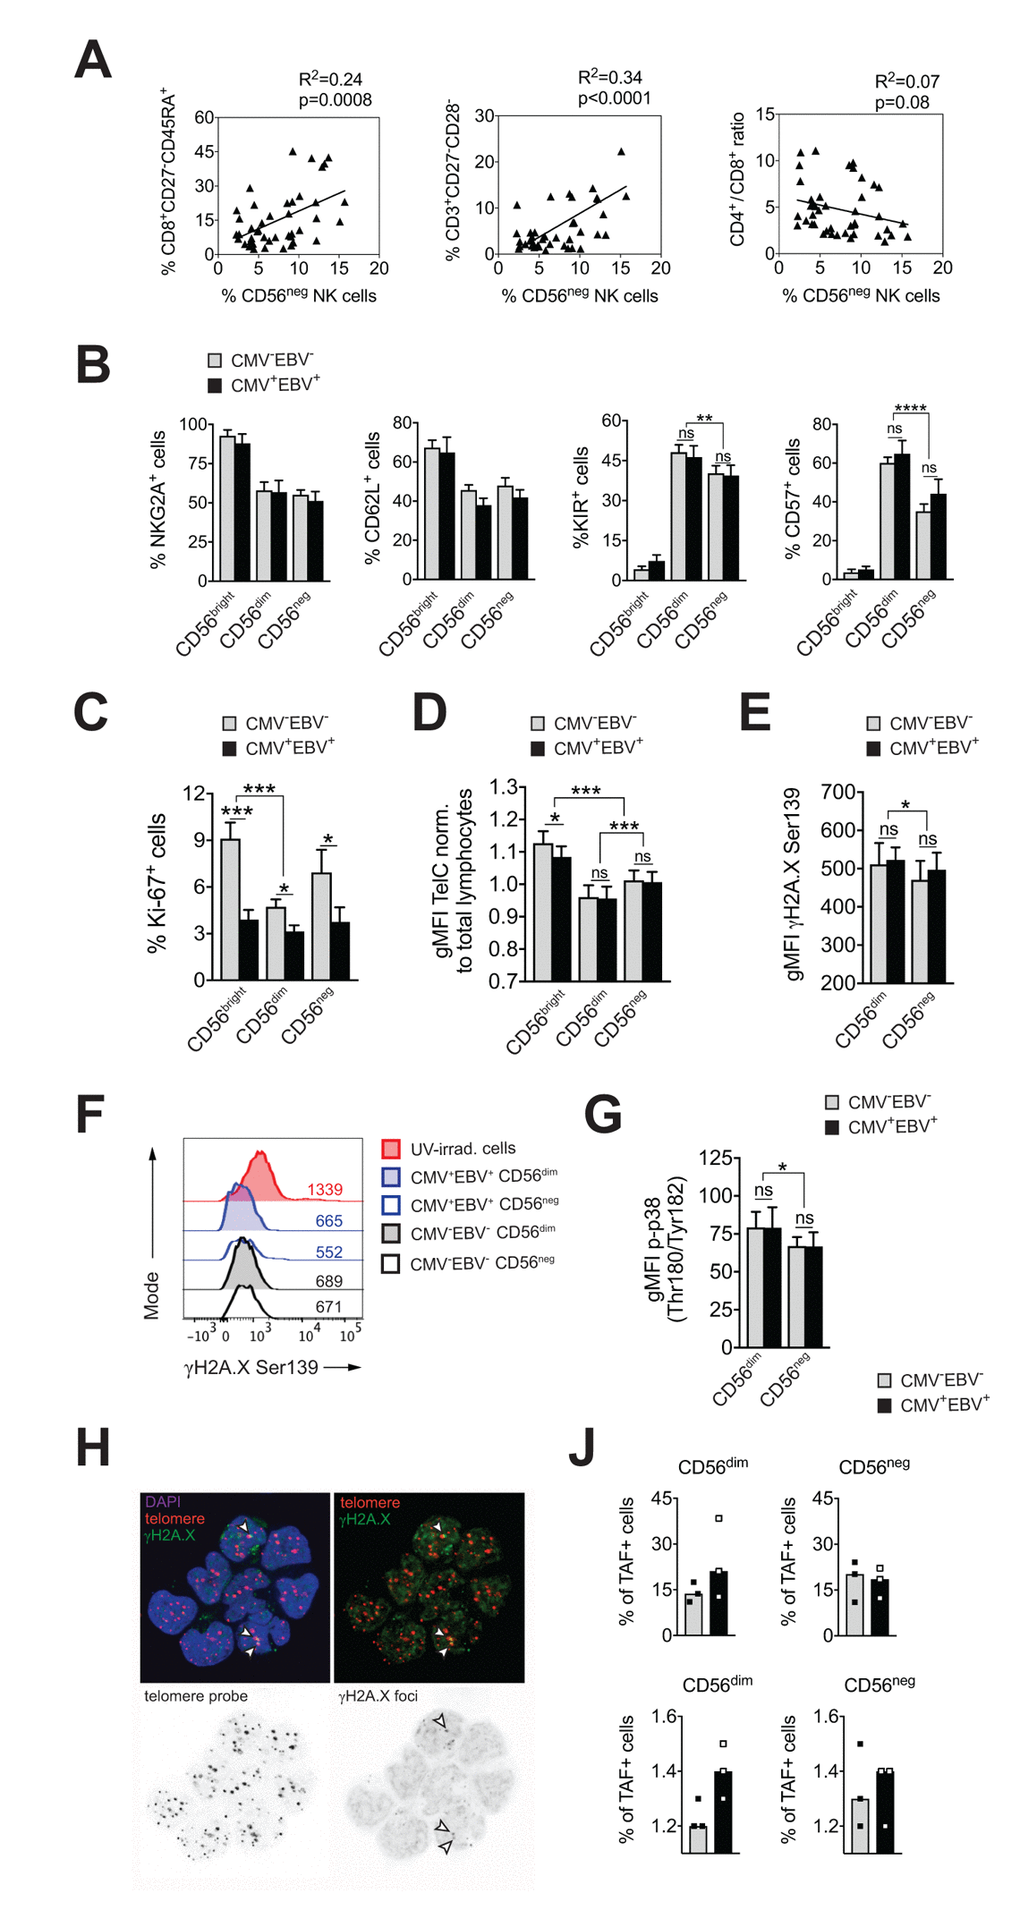
Figure 2. CD56neg NK cells do not acquire cell senescence characteristics. (A) Frequencies of CD56neg NK cells in relation to CD8+ EMRA T cells (left panel), CD27-CD28- T cells (middle panel) and the CD4 / CD8 T cell ratio (right panel) as assessed by FACS analysis in total PBMCs (n=53/55). Data were analyzed by linear regression: correlation strength (R2) and statistical significance (p-value) are indicated for each scatter plot. (B) The differentiation stage of CD56neg NK cells was assessed by FACS analysis for NKG2A, CD62L, KIR and CD57 expression in total PBMCs. CD56neg NK cells were compared to CD56bright and CD56dim NK cells from CMV–EBV– (gray bars, n=10/11) and CMV+EBV+ donors (black bars, n=10/14). (C) Proliferation of NK cell subsets from CMV–EBV– (gray bars, n=10/11) and CMV+EBV+ (black bars, n=10/14) donors as assessed directly ex vivo by FACS analysis for Ki-67 expression. (D) Telomere length of NK cell subsets in CMV–EBV– (gray bars, n=10/10) and CMV+EBV+ donors (black bars, n=10/14) as assessed by FACS-based FISH-technique. Data are shown as geometric mean of fluorescence intensity (gMFI) of the telomere probe (TelC), normalized to the gMFI TelC value of the total lymphocyte population for each donor. (E) Global phosphorylation of the histone H2A.X (γH2A.X Ser139) in CD56dim and CD56neg NK cells in CMV–EBV– (gray bars, n=8/11) and CMV+EBV+ donors (black bars, n=9/14) as assessed directly ex vivo by FACS analysis. (F) Representative histograms for γH2A.X staining in a CMV–EBV– (gray histograms) and CMV+EBV+ (blue histograms) donor. UV-irradiated PBMCs served as positive control. (G) Phosphorylation of p38-MAPK Thr180/Tyr182 in CD56dim and CD56neg NK cells in CMV–EBV– (gray bars, n=8/11) and CMV+EBV+ (black bars, n=9/14) donors analyzed directly ex vivo by FACS analysis. (H) Representative telomere fluorescence in situ hybridization images showing overlay images of the nuclear staining (DAPI, purple) with telomere probe (red) and γH2A.X Ser139 (green) (top left) and co-localization of telomere probe and γH2A.X foci = telomere-associated fluorescence (TAF) (top right panel). White arrows indicate TAF. Greyscale stack images of the telomere probe (bottom left) and γH2A.X foci are shown (bottom right). (J) Cumulative data from CMV–EBV– (gray bars, n=3) and CMV+EBV+ (black bars, n=3) donors are shown analyzed as in (H). Top panel shows the frequency of TAF+ cells, bottom panel the number of TAF / TAF+ cell in CD56dim and CD56neg NK cells. (A-G) Experiments were performed on total PBMCs. (H, J) Experiments were performed on FACS-sorted CD56dim and CD56neg NK cells. For parametric data mean ± SEM, for non-parametric data median ± IQR are shown. * p≤0.05, ** p≤0.005, *** p≤0.005, **** p≤0.0005, ns=not significant.
This newly identified association of CD56neg NK cells with the IRP raised the question whether CD56neg NK cells are a terminally-differentiated subset as well, and whether they display cell senescence characteristics. To determine the differentiation stage of CD56neg NK cells we analyzed cell surface expression of NKG2A, CD62L, the Killer-cell Immunoglobulin-like Receptors (KIRs), and CD57. Expression of NKG2A and CD62L in NK cells is reciprocal to KIR and CD57 expression, with a step-wise reduction in NKG2A and CD62L and progressive acquisition of KIR and CD57 with differentiation [38,39]. In our cohort, CD56neg NK cells displayed a decrease in NKG2A and CD62L expression and acquisition of KIR and CD57 compared to CD56bright NK cells irrespective of the serostatus of the donors (Figure 2B and Supplementary Figure S2B), suggesting that CD56neg cells have a mature phenotype. Compared to CD56dim NK cells, however, CD56neg NK cells expressed significantly less KIR and CD57 (Figure 2B and Supplementary Supplementary Figure S2B). CD57 expression defines mature NK cells with potent effector function [40], and acquisition of KIR is associated with ‘licensing’ of the NK cell (a process in which only cells that express KIR for self-MHC molecules acquire maximal functional capacity [41]). Absence of these two markers could point to either a more immature cell subset that has not acquired full effector functions, or a cell subset with faulty licensing, respectively, which would be in line with their reduced effector functions as shown in Figure 1D-F.
Having established that CD56neg NK cells have a mature phenotype, we next investigated whether they acquire cell senescence characteristics. Loss of proliferative capacity is a hallmark of cell senescence. Therefore, we first assessed proliferation of NK cell subsets directly ex vivo, by staining for Ki-67, expression of which is found in cycling cells only. CD56neg NK cells had intermediate levels of Ki-67 expression compared to CD56bright and CD56dim NK cells, recapitulating our phenotyping results in Figure 2B, that established an intermediate differentiation phenotype for the CD56neg NK cell subset. Intriguingly, we observed reduced Ki-67 expression in all three NK cell subsets in CMV+EBV+ donors when compared to CMV–EBV– individuals and this reduction was most pronounced in CD56bright NK cells (Figure 2C). There was no significant difference in Ki-67 expression between CMV–EBV– and single positive (CMV–EBV+ and CMV+EBV–) donors (Supplementary Figure 2C). In senescent cells, the defect in proliferative capacity is occasionally associated with telomere erosion. To test whether CD56neg NK cells display telomere-dependent senescence, we measured telomere length by flow-cytometry based fluorescence in situ hybridization (FISH)-method. CD56neg NK cells displayed intermediate telomere length compared to CD56bright and CD56dim NK cells, excluding critical telomere shortening in CD56neg NK cells as an explanation for the low Ki-67 levels (Figure 2D). Interestingly, telomere shortening was associated with CMV and EBV co-infection in more immature cell subsets such as CD56bright NK cells (Figure 2D) and naïve CD8+ T cells (Supplementary Figure 2D). Alternatively, cell senescence can be induced by DNA damage such as DNA double strand breaks (DSBs), which are marked by phosphorylation of histone 2A.X (γH2A.X) and that elicit DNA repair mechanisms collectively termed as DNA damage response (DDR). Similar to telomere-associated replicative senescence, stress-induced and age-associated senescence leads to the formation of DNA-damage foci and activation of the DDR [42]. To test for DDR activation in CD56neg NK cells we first probed global phosphorylation of H2A.X and spontaneous activation of p38 mitogen-activated protein kinase (MAPK) [43,44] in CD56neg and CD56dim NK cells by FACS. Interestingly, H2A.X phosphorylation (Figure 2E, F) and p-p38 MAPK levels (Figure 2G) were lower in CD56neg compared to CD56dim NK cells (Figure 2G) and no significant effect of CMV and EBV co-infection was seen on H2A.X and p38 phosphorylation (Figure 2E-G). In a recent report from Hewitt et al., persistent DNA damage foci, that failed to be resolved by the DDR, mapped to telomeres/telomere associated structures rather than genomic DNA, presumably because of the inaccessibility of telomeres to the DDR machinery [42]. Such persistent DNA damage foci can be revealed by co-localization of γH2A.X with telomeres in a fluorescence in situ hybridization protocol and reliably identified senescent fibroblasts [42]. To further corroborate our findings of telomere-independent senescence, we applied this immune-FISH procedure on sorted CD56neg and CD56dim NK cells from all four subgroups of the cohort (n=3 each). Telomere-associated fluorescence (TAF) was defined as co-localization of γH2A.X with the telomere probe (Figure 2H). We found that the frequency of TAF-positive cells was strongly donor-dependent, ranging from 11 to 38% of NK cells, and it showed no clear association with CMV and EBV serostatus (Figure 2J and Supplementary Figure 2E, upper panels). There was no difference in the frequency of TAF-positive cells between CD56neg and CD56dim NK cells (18.2% vs 19.6% (mean TAF+ cells CD56neg vs CD56dim). Likewise, the number of TAF foci / TAF+ cell was not different between the groups (Figure 2J and Supplementary Figure 2E, bottom panels). Taken together, our data argue against a senescent phenotype in CD56neg NK cells.
CD56neg NK cells lack features of exhausted cells
Exhausted NK cells have been described in chronic HIV, CMV and hepatitis B and C virus infection, and in human and animal cancers. Common characteristics of exhausted NK cells are impaired cytotoxicity and cytokine secretion, down-regulation of activating NK cell receptors and upregulation of inhibitory receptors, such as TIM-3 and PD-1. The transcription factors Eomesodermin (Eomes) and T-box transcription factor (T-bet) are modulated during maturation of NK cells, with progressive T-bet upregulation and Eomes down-regulation toward terminal differentiation [45]. Gill et al. described reduced expression of Eomes and T-bet as a molecular signature of exhausted NK cells in an animal model of lymphoma [46]. To test if expanding CD56neg NK cells in CMV+EBV+ donors have features of exhausted cells, we first assessed expression of T-bet and Eomes in CD56neg NK cells within all 4 subgroups of the cohort and compared them to CD56dim NK cells. We found reduced T-bet expression in CMV+EBV+ individuals compared to CMV–EBV– donors for both NK cell subsets (Figure 3A). This was exemplified by an increase in cells expressing low levels of T-bet (T-betlo) and a decrease in cells with high T-bet expression (T-bethi) (Figure 3B, upper panel). Eomes expression tended to be lower in CMV+EBV+ compared to CMV–EBV– donors (Figure 3B, lower panel). CMV single positive (CMV+EBV–) donors showed a similar trend in T-bet and Eomes modulation as CMV+EBV+ donors (Supplementary Figure S3A), suggesting that changes in T-bet and Eomes expression are associated with CMV infection and are further enhanced by EBV co-infection. Nonetheless, differences in T-bet and Eomes expression between CD56dim and CD56neg NK cells were tenuous and cannot account for the reduced effector functions seen in CD56neg NK cells.
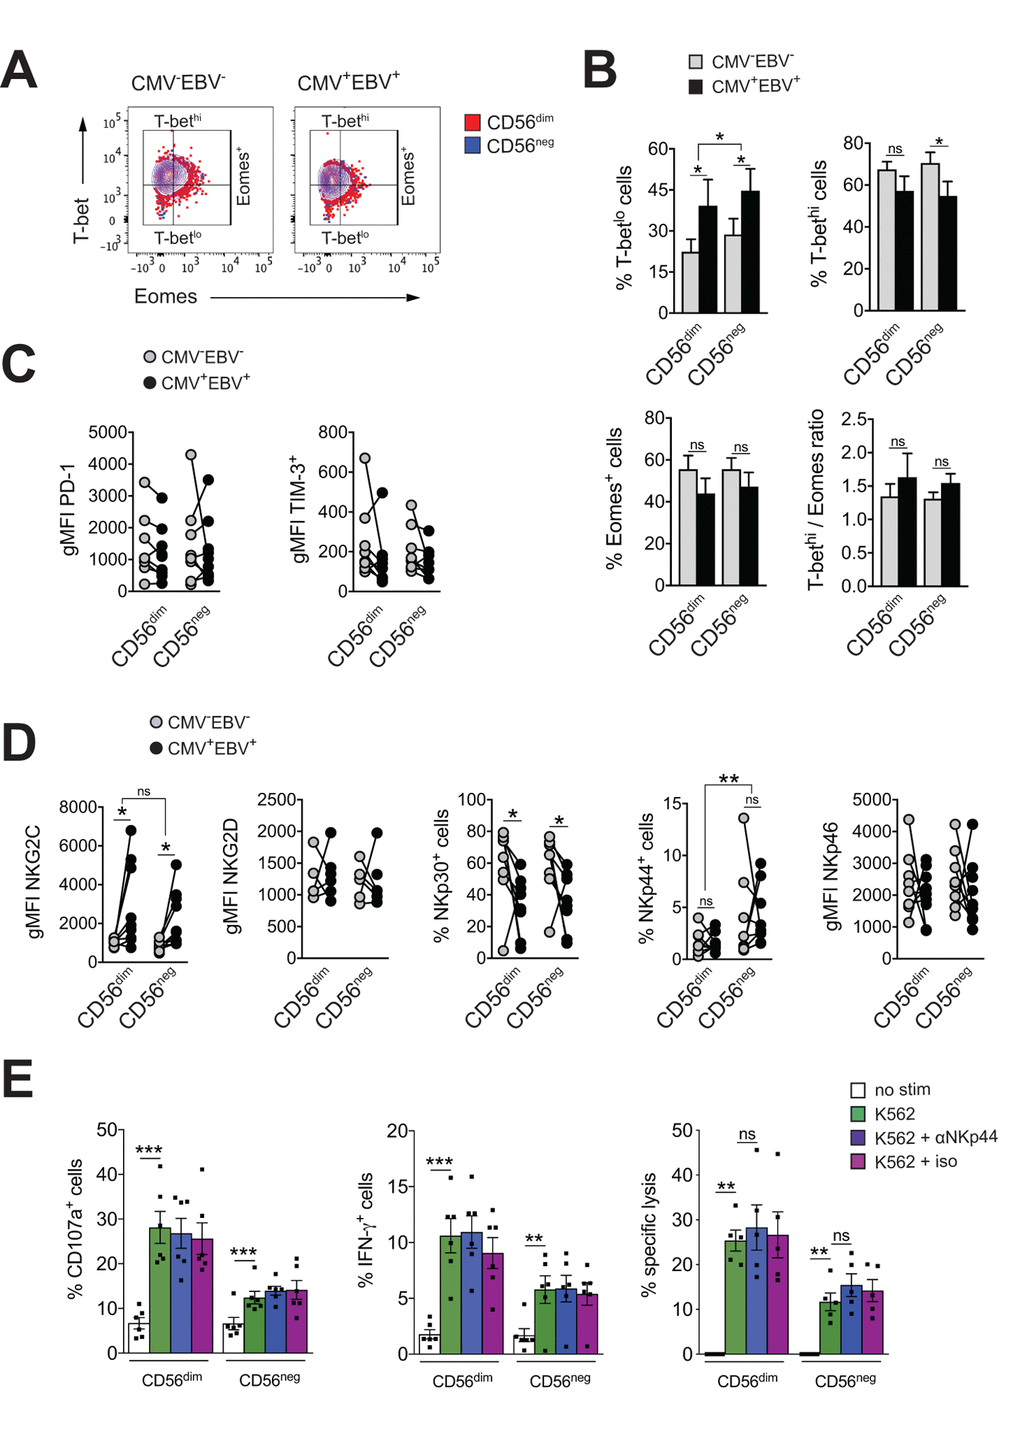
Figure 3. CD56neg NK cells lack features of exhausted cells. (A) Overlay contour plot analysis comparing T-bet and Eomes expression in CD56dim (red) and CD56neg (blue) NK cells from a representative CMV–EBV– (left panel) and CMV+EBV+ (right panel) donor. Gating strategy for T-bet-high (T-bethi), T-bet-low (T-betlo) and Eomes-positive (Eomes+) cells is indicated. (B) The percentage of T-betlo, T-bethi and Eomes+ cells, as well as the T-bet / Eomes ratio (Tbethi / Eomes+) are shown in CD56dim versus CD56neg NK cells from CMV–EBV– (gray bars, n=8/11) and CMV+EBV+ (black bars, n=8/14) donors analyzed as in (A). (C) PD1- and TIM-3 expression on CD56dim and CD56neg NK cells from CMV–EBV– (gray circles, n=8/11) compared to CMV+EBV+ (black circles, n=9/14) donors. (D) Cell surface expression of activating NK cell receptors NKG2C and NKG2D and natural cytotoxicity receptors NKp30, NKp44 and NKp46 on CD56dim and CD56neg NK cells from CMV–EBV– (gray circles, n=8/11) compared to CMV+EBV+ (black circles, n=9/14) donors. (C, D) Values are expressed as gMFI for unimodal data, and as % of positive cells for bimodal data. (E) FACS-sorted CD56dim and CD56neg NK cells were either left un-stimulated (empty bars), stimulated with K562 cells alone (green bars) or K562 cells and a blocking NKp44 monoclonal antibody (blue bars) or an isotype control (purple bars), respectively, and expression of CD107a, IFN-γ and target cell lysis was assessed as described. Experiments were performed on total PBMCs in (A-D) and on FACS-sorted CD56dim and CD56neg NK cells in (E). For parametric data mean ± SEM, for non-parametric data median ± IQR are shown. Data were analyzed by Student’s t-test and Mann-Whitney test, respectively. * p≤0.05, ** p≤0.005, *** p≤0.005, ns=not significant.
Expression of the immune check-point inhibitors PD-1 and TIM-3 have been reported on NK cells in HIV and HCV infection as well as various tumor models, and blockade of each receptor alone, or in combination, was shown to reverse NK cell exhaustion [47–49]. We therefore tested for the expression of PD-1 and TIM-3 within all 4 subgroups of our cohort. There was no difference in PD-1and TIM-3 expression between CD56dim and CD56neg NK cells irrespective of the serostatus of the donor (Figure 3C). We next performed phenotypic analyses for the activating NK cell receptors NKG2C, NKG2D, and the natural cytotoxicity receptors (NCRs) NKp30, NKp44 and NKp46. The association of the activating NK cell receptor NKG2C with CMV is well established. Correspondingly, we found increased levels of NKG2C on both NK cell subsets with CMV infection that were further increased by EBV co-infection (Figure 3D and Supplementary Figure S3B). There was no significant difference in NKG2C expression between CD56dim and CD56neg NK cells (Figure 3D and Supplementary Figure S3B). In contrast, expression of the natural cytotoxicity receptor NKp30 was reduced with CMV and EBV co-infection on both NK cell subsets (Figure 3D and Supplementary Figure S3B). Further, CD56neg NK cells had higher levels of NKp44 expression than CD56dim NK cells irrespective of the serostatus of the donors (Figure 3D and Supplementary Figure S3B). In circulation, NKp44 is found on activated NK cells only, and engagement of the receptor by activating ligands mediates release of cytotoxic granules, IFN-γ and TNF-α. In contrast to other NCRs, NKp44 is endowed with an inhibitory function as well, and it has been postulated that tumors exploit this axis to escape NK cell attack [50,51]. Therefore, we next blocked NKp44 with a monoclonal antibody on sorted CD56dim and CD56neg NK cells, or an isotype control, respectively, and tested expression of CD107a, and IFN-γ production in response to K562 target cells as well as lysis of K562 target cells. While both CD56dim and CD56neg NK cells readily increased CD107a and IFN-γ expression after target cell stimulation, no effect on effector functions was seen with NKp44 blockade or the isotype control (Figure 3E) arguing against a role for NKp44 in inhibiting NK cell effector functions.