


Introduction
Pancreatic cancer ranks as the third leading cause of cancer-related deaths in the United States [1]. Pancreatic cancer is one of the most quickly fatal cancers all over the world, with mortality almost equal to its incidence [2]. Besides, pancreatic cancer lacks of obvious early symptoms, thereby leading to most patients with pancreatic cancer being diagnosed at advanced stages. Over the past years, in spite of huge improvements in surgery, chemotherapy and radiotherapy for pancreatic cancer have been achieved, prognosis is still extremely dismal with nearly 100% of 5-year mortality rate [2,3]. Furthermore, to date, the precise mechanisms how pancreatic cancer occurs and progresses are still not clearly elucidated. It is essential to explore underlying molecular mechanisms and develop effective therapeutic targets and novel prognostic biomarkers for pancreatic cancer.
In 2011, Salmena et al. proposed a novel regulatory mechanism between noncoding RNA (ncRNA) and messenger RNA (mRNA), namely competing endogenous RNA (ceRNA) hypothesis [4]. In this theory, cross-talk between ceRNAs achieves by competitively binding to shared miRNAs [5]. The discovery of ceRNA mechanism has attracted the attention of many researchers and scholars. They conducted a variety of related investigations in respective study field, including cancer. Long non-coding RNAs (lncRNAs) are a class of ncRNA with length more than 200 nucleotides, which have been reported to act as miRNA sponges to decrease miRNA abundance, thus relieving inhibitory effect of miRNA on downstream target genes [6–9]. Increasing evidence has well documented that lncRNA-miRNA-mRNA ceRNA network plays key roles in multiple human cancers, such as breast cancer [10], gastric cancer [11], liver cancer [12] as well as pancreatic cancer [13]. However, current knowledge for lncRNA-miRNA-mRNA in human cancers is not enough, including pancreatic cancer.
In this study, we first acquired aberrantly expressed mRNAs by mining two GEO datasets. Subsequently, we conducted functional enrichment analysis for these aberrantly expressed mRNAs. Then, protein-protein interaction analysis was also employed, and hub genes were identified. By combining expression and prognostic roles of hub genes in pancreatic cancer, 7 upregulated genes and 2 downregulated genes were selected for subsequent analysis. Next, upstream miRNAs and lncRNAs were predicted. Besides, we also further evaluated the prognostic roles of these miRNAs and lncRNAs in pancreatic cancer. The correlations of mRNAs, miRNAs and lncRNAs were also determined. Finally, a novel ceRNA regulatory sub-network associated with pancreatic cancer patients’ prognosis was successfully established. Intriguingly, each RNA in this ceRNA network may be utilized to indicate prognosis of pancreatic cancer based on our current analytic results. They may also serve as promising diagnostic biomarkers or therapeutic targets for pancreatic cancer in the future.
Results
Screening of significant DEGs in pancreatic cancer
In search of gene expression microarrays regarding pancreatic cancer in the GEO database, two datasets (GSE16515 and GSE15471) were finally included. Subsequently, differential expression analysis was conducted by using GEO2R (|log2FC| > 1 and adj. p-value < 0.05), and some DEGs in each dataset were discovered. These DEGs from GSE16515 and GSE15471 datasets were shown in Figure 1A and Figure 1B, respectively. Next, we further identified some significant DEGs which were commonly appeared in the two datasets. As shown in Figure 1C and Figure 1D, a total of 734 and 180 upregulated and downregulated significant DEGs in pancreatic cancer were identified. These upregulated and downregulated significant DEGs were concretely listed in Table S1 and Table S2, respectively. Also, these significant DEGs were selected for subsequent analyses.
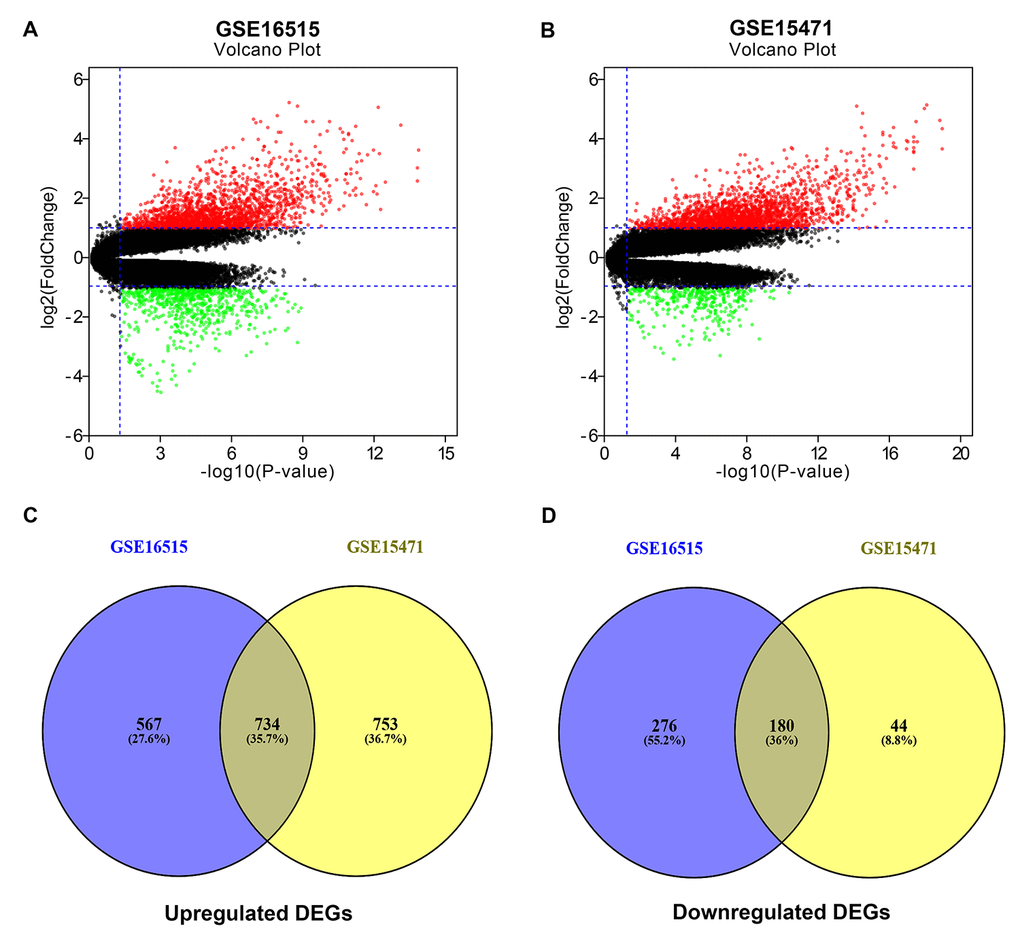
Figure 1. Identification of significant differentially expressed genes (DEGs) in pancreatic cancer. (A) Volcano plot showing the DEGs identified from GSE16515. (B) Volcano plot showing the DEGs identified from GSE15471. X axis represents log transformed P value, and Y axis indicates the mean expression differences of genes between pancreatic cancer samples and normal samples. Note: The two volcano plots showed all of the DEGs; the black dots represent genes that are not differentially expressed between pancreatic cancer samples and normal samples, and the green dots and red dots represent the downregulated and upregulated genes in pancreatic cancer samples, respectively. |log2FC| >1 and adj. p-value < 0.05 were set as the cut-off criteria. (C) The intersection of upregulated DEGs of GSE16515 and GSE15471 datasets. (D) The intersection of downregulated DEGs of GSE16515 and GSE15471 datasets. The intersected DEGs were defined as the significant DEGs.
Functional enrichment analysis for the significant DEGs
To predict the underlying biological function and corresponding pathways of these significant DEGs, DAVID database was introduced to perform functional enrichment analysis, including three GO terms (BP: biological process; CC: cellular component; MF: molecular function) and KEGG pathway.
For upregulated significant DEGs, as presented in Figure 2A-C, the enriched GO functions included cell adhesion, extracellular matrix organization and wound healing in the BP category; protein binding, calcium ion binding and cadherin binding involved in cell-cell adhesion in the MF category; and extracellular exosome, plasma membrane and membrane in the CC category. Besides, Figure 3A revealed that these upregulated significant DEGs were significantly enriched in some cancer-associated pathways, such as pathways in cancer, focal adhesion, proteoglycans in cancer and small cell lung cancer.
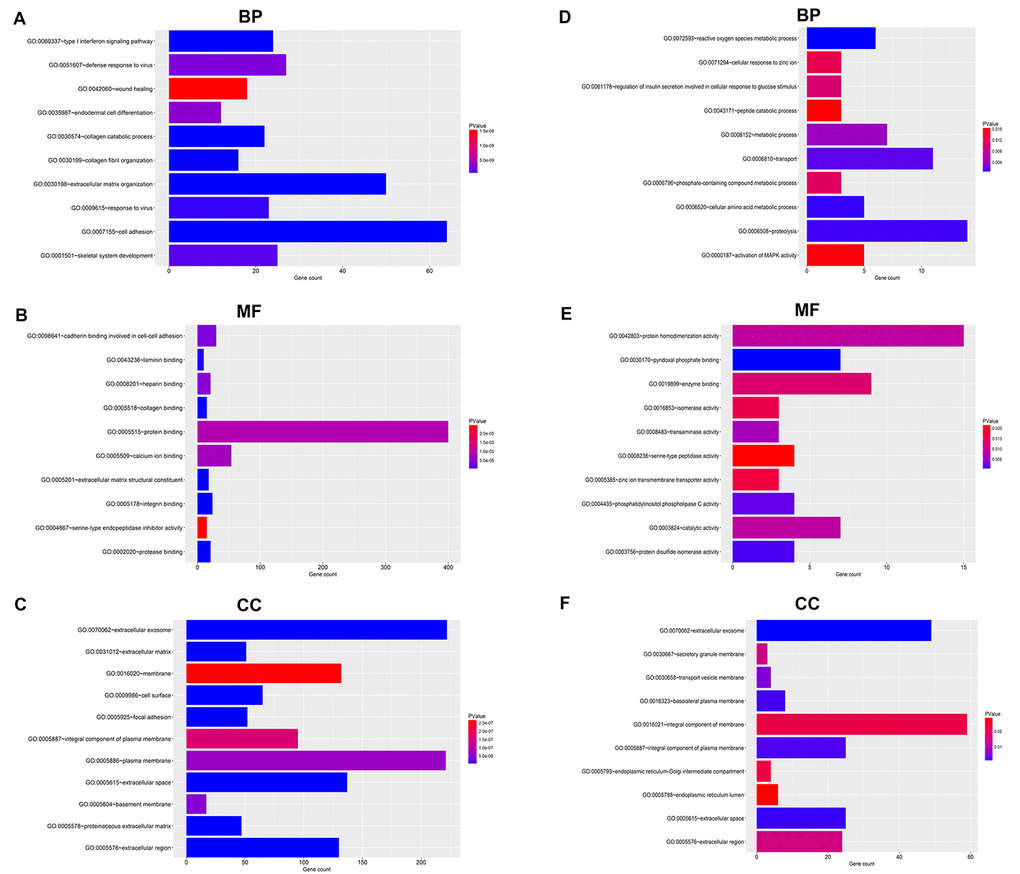
Figure 2. GO functional annotation for the significant DEGs. (A) The top ten enriched biological process (BP) of the upregulated significant DEGs. (B) The top ten enriched molecular function (MF) of the upregulated significant DEGs. (C) The top ten enriched cellular component (CC) of the upregulated significant DEGs. (D) The top ten enriched biological process (BP) of the downregulated significant DEGs. (E) The top ten enriched molecular function (MF) of the downregulated significant DEGs. (F) The top ten enriched cellular component (CC) of the downregulated significant DEGs.
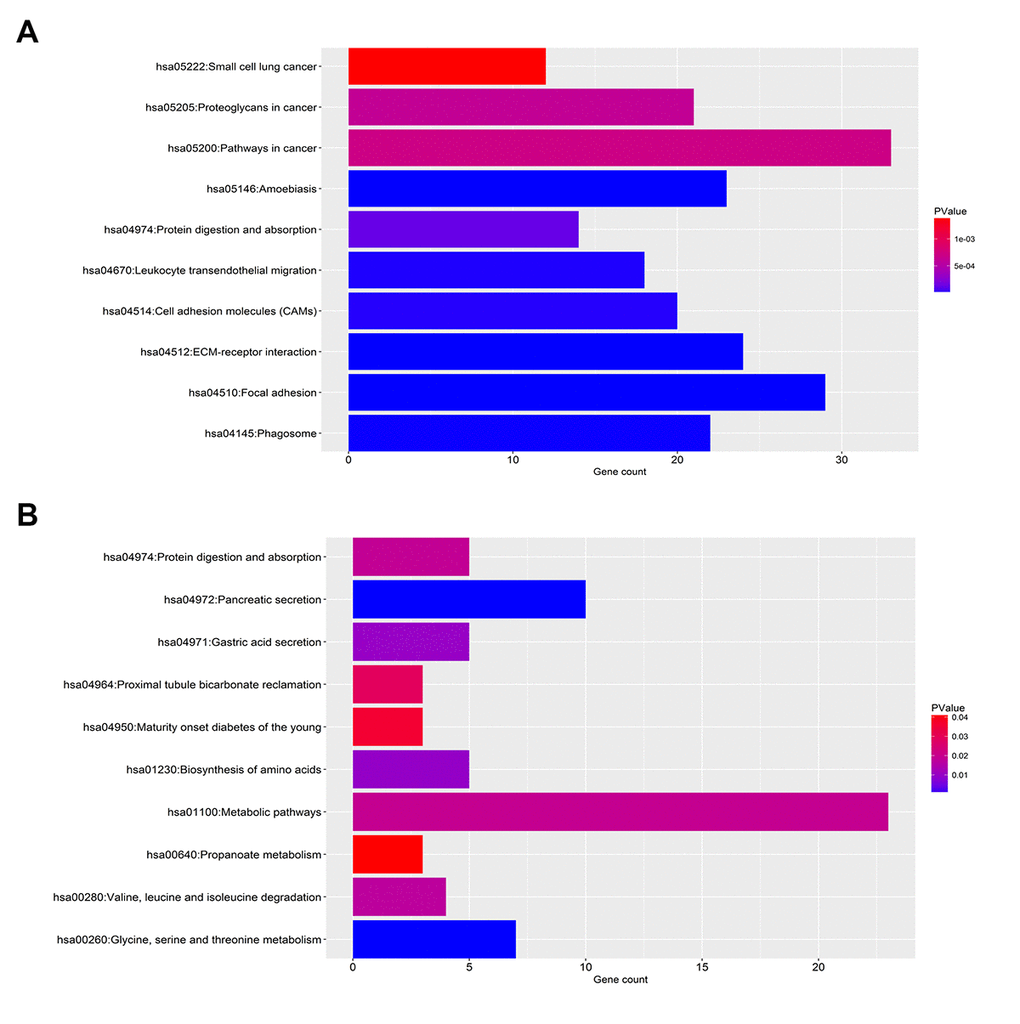
Figure 3. KEGG pathway enrichment analysis for the significant DEGs. (A) The top ten enriched KEGG pathways of the upregulated significant DEGs. (B) The top ten enriched KEGG pathways of the downregulated significant DEGs.
As shown in Figure 2D-E, the enriched GO functions for downregulated significant DEGs included proteolysis, transport and metabolic process in the BP category; protein homodimerization activity, enzyme binding and pyridoxal phosphate binding in the MF category; and integral component of membrane, extracellular exosome and integral component of plasma membrane in the CC category. Similarly, some enriched KEGG pathways were also observed, among which metabolic pathways, pancreatic secretion and glycine, serine and threonine metabolism were the most highly enriched pathways (Figure 3B).
Establishment and analysis of PPI network
On the basis of the data from STRING database analysis, PPI networks of the upregulated significant DEGs and downregulated significant DEGs were constructed as shown in Figure 4A and Figure 4C, respectively. According to node degree, we identified some hub genes among these significant DEGs. For better visualization, the interactors of top 30 upregulated (Figure 4B) and downregulated (Figure 4D) hub genes were re-built using Cytoscape software. Additionally, the top 30 hub genes and their corresponding node degrees were listed in Table 1 and top 10 upregulated hub genes were TGFB1, MMP9, CXCL8 (IL8), ACTB, ITGB1, STAT1, TOP2A, ACTA2, ICAM1 and CDK1, and top 10 downregulated hub genes were ALB, EGF, P4HB, MAT1A, GNMT, ABAT, CBS, CTH, PRSS3 and ECI2. The 20 hub genes were chosen for following analyses.
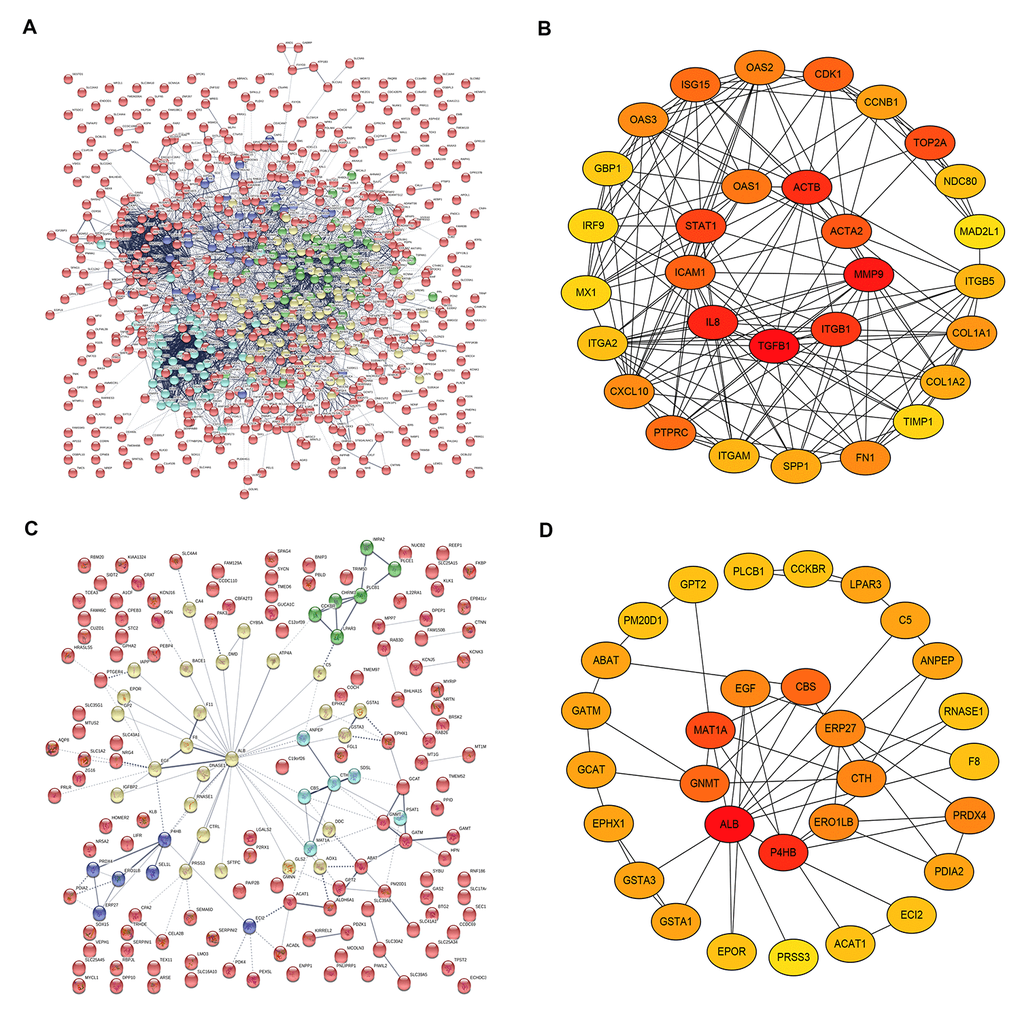
Figure 4. The top 30 hub genes identified in protein-protein interaction (PPI) networks. (A) The PPI network of the significant upregulated DEGs. (B) The top 30 hub genes of the significant upregulated DEGs. (C) The PPI network of the significant downregulated DEGs. (D) The 30 hub genes of the significant downregulated DEGs.
Table 1. The top 30 hub genes in PPI networks.
| Upregulated gene | Downregulated gene | ||
| Gene symbol | Degree | Gene symbol | Degree |
| TGFB1 | 94 | ALB | 28 |
| MMP9 | 78 | EGF | 10 |
| CXCL8 (IL8) | 75 | P4HB | 8 |
| ACTB | 70 | MAT1A | 6 |
| ITGB1 | 67 | GNMT | 6 |
| STAT1 | 65 | ABAT | 6 |
| TOP2A | 64 | CBS | 6 |
| ACTA2 | 58 | CTH | 6 |
| ICAM1 | 57 | PRSS3 | 5 |
| CDK1 | 57 | ECI2 | 5 |
| PTPRC | 56 | PLCB1 | 5 |
| ISG15 | 56 | ERP27 | 4 |
| OAS1 | 55 | PM20D1 | 4 |
| OAS2 | 53 | PRDX4 | 4 |
| FN1 | 52 | GCAT | 4 |
| CXCL10 | 52 | LPAR3 | 4 |
| OAS3 | 52 | CCKBR | 4 |
| COL1A1 | 51 | EPHX1 | 4 |
| CCNB1 | 47 | ACAT1 | 4 |
| SPP1 | 46 | ERO1LB | 4 |
| COL1A2 | 46 | GATM | 4 |
| ITGB5 | 45 | EPOR | 3 |
| ITGAM | 45 | GPT2 | 3 |
| ITGA2 | 43 | RNASE1 | 3 |
| NDC80 | 43 | PDIA2 | 3 |
| GBP1 | 42 | ANPEP | 3 |
| IRF9 | 41 | C5 | 3 |
| MX1 | 41 | AOX1 | 3 |
| TIMP1 | 41 | SDSL | 3 |
| HLA-A | 40 | CHRM3 | 3 |
Identification of key genes in pancreatic cancer
In order to further identify key genes in pancreatic cancer, we determined the expression and prognostic values of the top 10 upregulated and downregulated hub genes using GEPIA and Kaplan-Meier plotter databases, respectively. Combined the results of expression analysis and survival analysis, we found that 7 upregulated hub genes (MMP9, CXCL8, ACTB, ITGB1, STAT1, TOP2A and CDK1) were not only significantly upregulated in pancreatic cancer samples but also the increased expression of the 7 genes indicated poor prognosis in patients with pancreatic cancer (Figure 5A and Figure 5C-I), and 2 downregulated hub genes (GNMT and ABAT) were commonly appeared in “low expression” gene set and “good prognosis” gene set (Figure 5B and Figure 5J-K). In next analyses, we are interested to investigate the 9 key genes, including 7 upregulated hub genes and 2 downregulated hub genes.
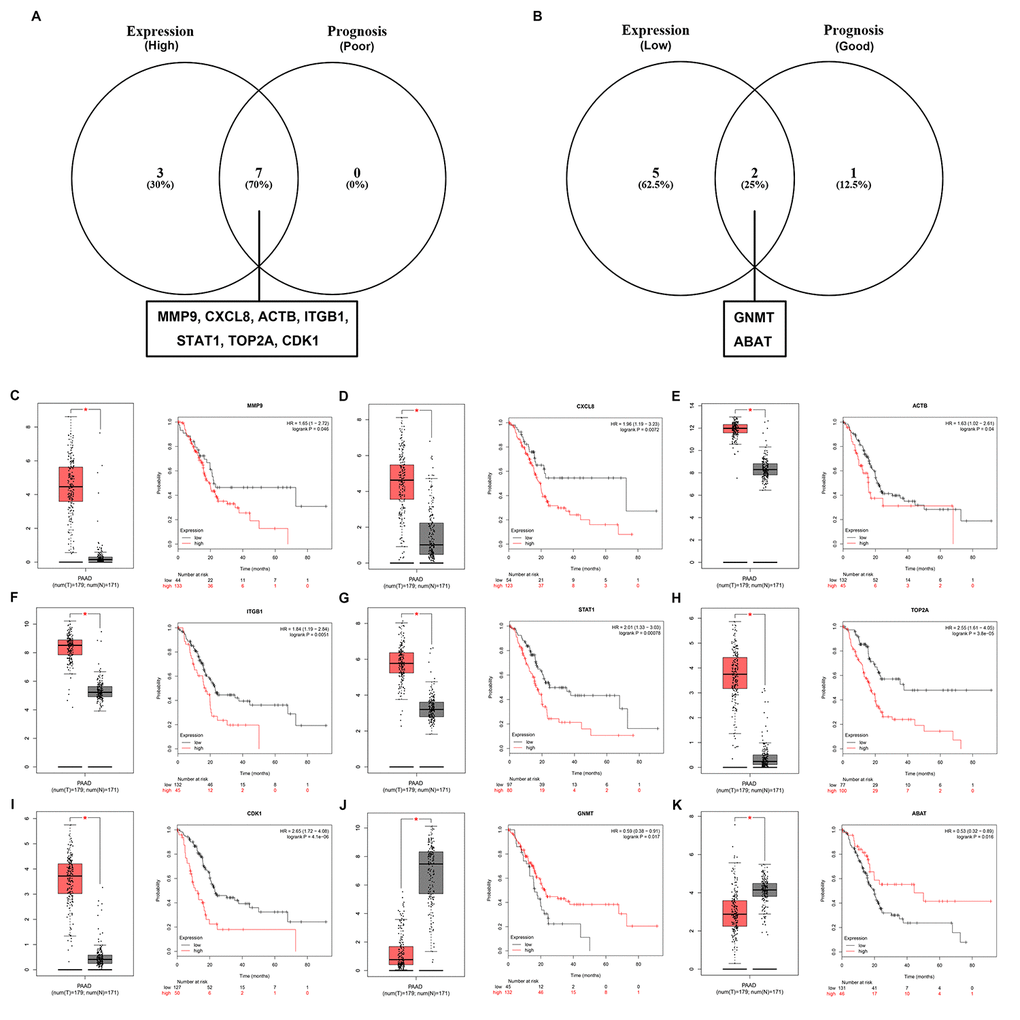
Figure 5. Screening the key genes in pancreatic cancer. (A) Identification of key genes among the top 10 hub genes of the significant upregulated DEGs by combining expression and prognosis analyses using GEPIA and Kaplan Meier-plotter databases, respectively. (B) Identification of key genes among the top 10 hub genes of the significant downregulated DEGs by combining expression and prognosis analyses using GEPIA and Kaplan Meier-plotter databases, respectively. (C) Expression and prognostic value of MMP9 in pancreatic cancer. (D) Expression and prognostic value of CXCL8 in pancreatic cancer. (E) Expression and prognostic value of ACTB in pancreatic cancer. (F) Expression and prognostic value of ITGB1 in pancreatic cancer. (G) Expression and prognostic value of STAT1 in pancreatic cancer. (H) Expression and prognostic value of TOP2A in pancreatic cancer. (I) Expression and prognostic value of CDK1 in pancreatic cancer. (J) Expression and prognostic value of GNMT in pancreatic cancer. (K) Expression and prognostic value of ABAT in pancreatic cancer.
Prediction and validation of upstream key miRNAs of key genes
Subsequently, we predicted upstream miRNAs of the 9 key genes by using an experimentally validated microRNA-target gene interactions database, miRTarBase. As mentioned above, in this study, we only included microRNA-target gene interactions that were validated by reporter assay. Finally, we identified a total of 33 miRNAs that could potentially regulate six key genes (ITGB1, MMP9, STAT1, CXCL8, CDK1 and ACTB) expression as presented in Figure 6 and Table S3. Upstream potential miRNAs of three other key genes (TOP2A, GNMT and ABAT) were not observed. Besides, we noticed that all the six key genes were upregulated hub genes, with unfavorable prognostic values in pancreatic cancer. Based on the classical inverse relationship between miRNA and target gene, we hypothesized that the upstream miRNAs of 6 upregulated key genes should theoretically display favorable prognostic roles. Therefore, we further assessed prognostic values of the 33 predicted miRNAs using Kaplan-Meier plotter database. The results of survival analysis showed that 8 (miR-132-3p, miR-133a-5p, miR-29b-3p, miR-491-5p, miR-192-5p, miR-29c-3p, miR-9-3p and miR-140-5p) out of 33 miRNAs functioned as positive prognostic biomarkers for patients with pancreatic cancer as presented in Figure 7. The 8 miRNAs were defined as the key miRNAs.
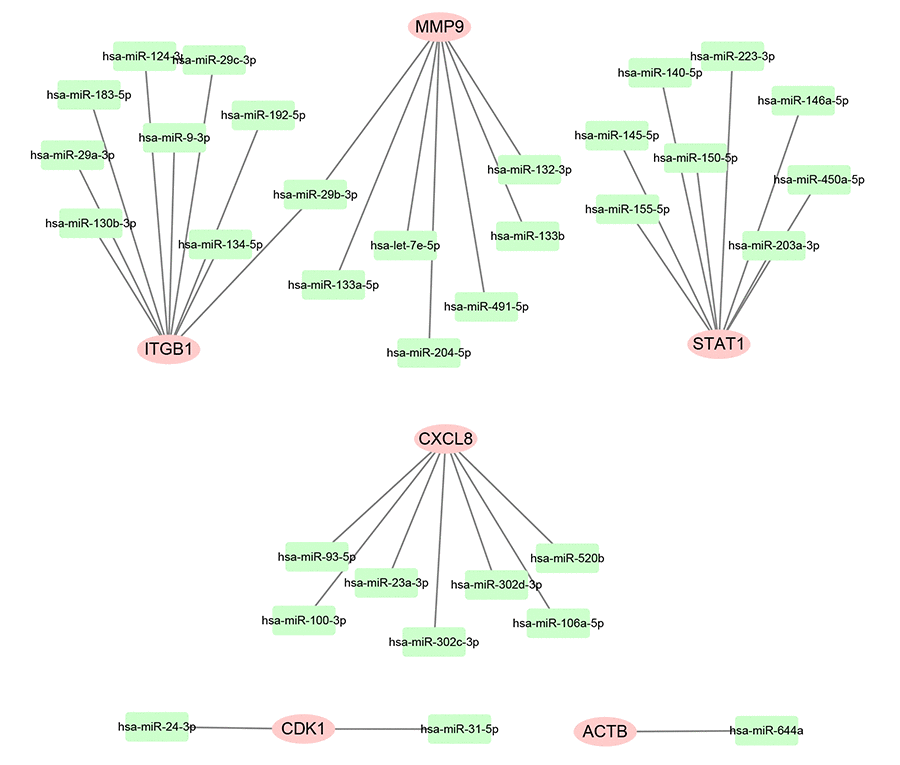
Figure 6. Construction of miRNA-gene network using Cytoscape software.
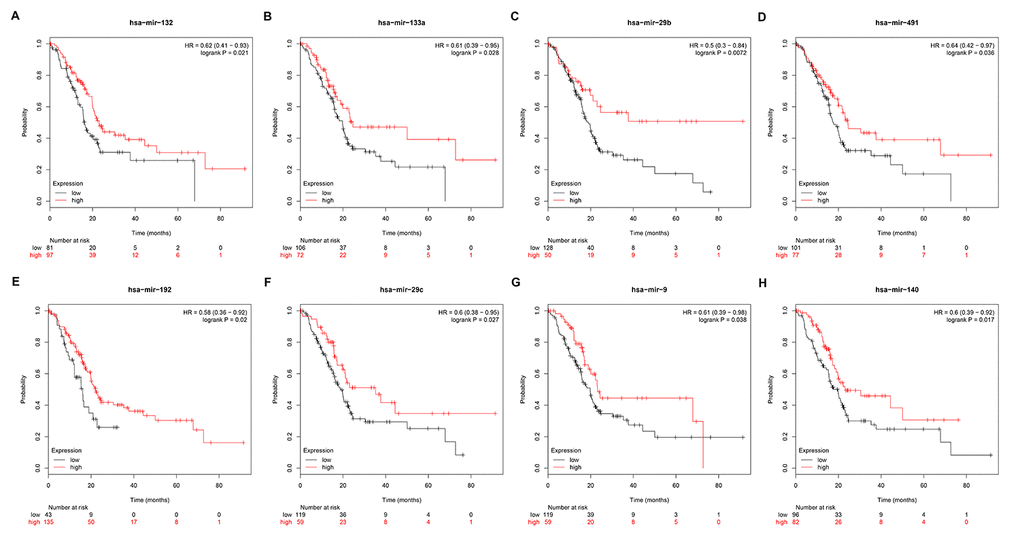
Figure 7. Prognostic values of miRNAs in pancreatic cancer. (A) Prognostic value of has-miR-132 in pancreatic cancer. (B) Prognostic value of has-miR-133a in pancreatic cancer. (C) Prognostic value of has-miR-29b in pancreatic cancer. (D) Prognostic value of has-miR-491 in pancreatic cancer. (E) Prognostic value of has-miR-192 in pancreatic cancer. (F) Prognostic value of has-miR-29c in pancreatic cancer. (G) Prognostic value of has-miR-9 in pancreatic cancer. (H) Prognostic value of has-miR-140 in pancreatic cancer.
Prediction and validation of upstream key lncRNAs of key miRNAs
Growing studies have suggested that lncRNA functions as ceRNA to interact with mRNA by competing for shared miRNA [14,15]. In view of this theory, we further predicted those lncRNAs that can potentially bind to the 8 key miRNAs (miR-132-3p, miR-133a-5p, miR-29b-3p, miR-491-5p, miR-192-5p, miR-29c-3p, miR-9-3p and miR-140-5p) using an online database miRNet. A total of 90 lncRNAs were discovered (Table S4). There is a negative correlation between lncRNA and miRNA based on the ceRNA hypothesis. Thus, we analyzed these lncRNAs expression in pancreatic cancer using GEPIA database. Only 10 (SCAMP1, EMG1, HCP5, TUG1, MAL2, H19, LINC00511, RP11-311C24.1, RP11-400F19.6 and CTC-459F4.3) out of 90 lncRNAs were significantly upregulated in pancreatic cancer samples when compared with normal controls. Subsequent survival analysis for the 10 upregulated lncRNAs demonstrated that patients with high expression of SCAMP1, HCP5, MAL2 and LINC00511 had unfavorable prognosis. Combined the results of expression analysis and survival analysis for these predicted lncRNAs, we re-defined the 4 lncRNAs (SCAMP1, HCP5, MAL2 and LINC00511) as key lncRNAs (Figure 8).
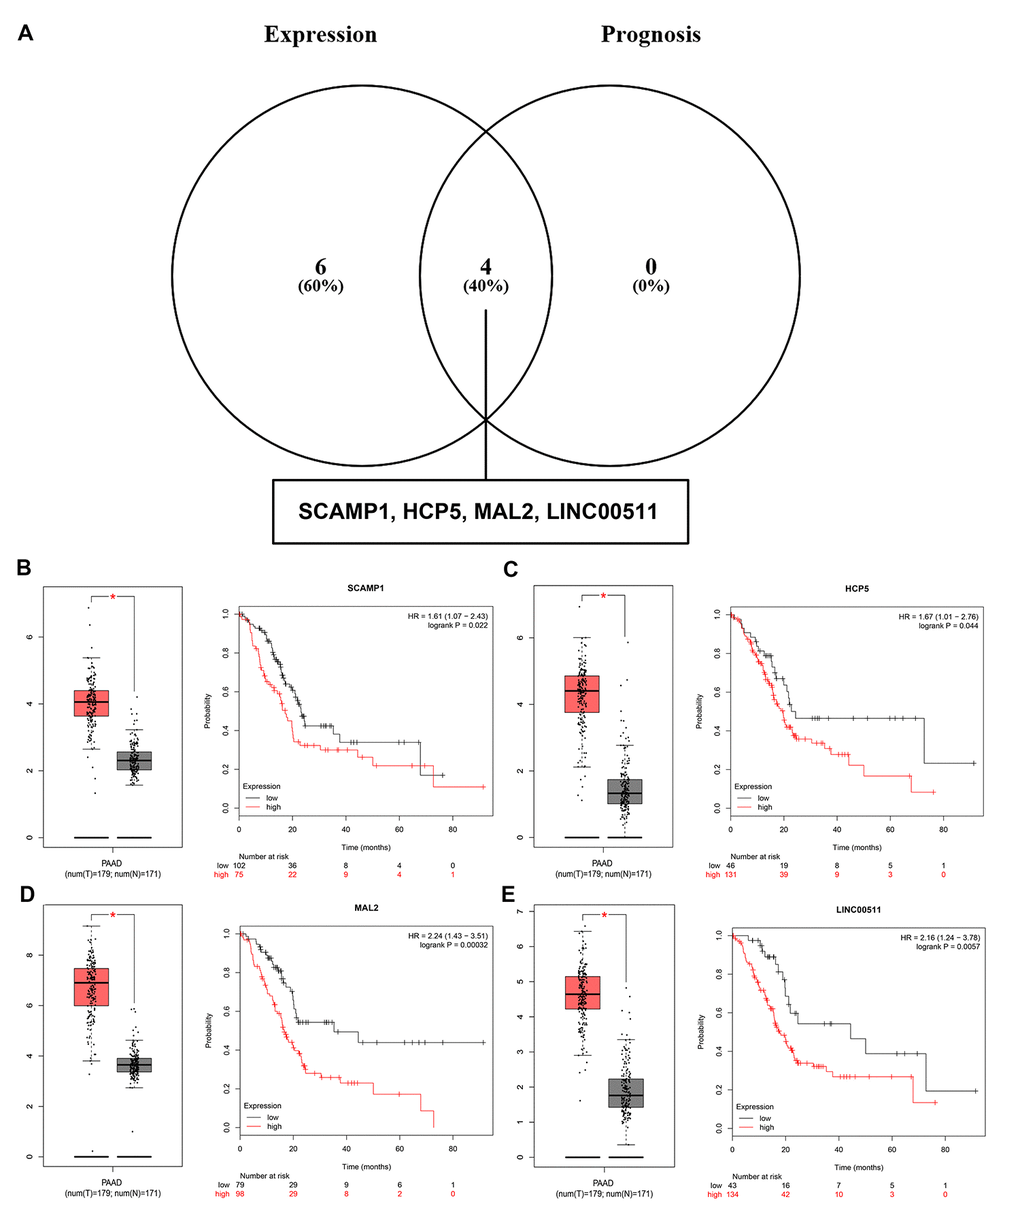
Figure 8. Screening the key lncRNAs in pancreatic cancer. (A) Identification of key lncRNAs among the predicted lncRNAs by combining expression and prognosis analyses using GEPIA and Kaplan Meier-plotter databases, respectively. (B) Expression and prognostic value of SCAMP1 in pancreatic cancer. (C) Expression and prognostic value of HCP5 in pancreatic cancer. (D) Expression and prognostic value of MAL2 in pancreatic cancer. (E) Expression and prognostic value of LINC00511 in pancreatic cancer.
Construction of key mRNA-miRNA -lncRNA triple sub-network in pancreatic cancer
By a series of in silico analyses, a key mRNA-miRNA-lncRNA competitive endogenous RNA triple regulatory network in pancreatic cancer were constructed. The network totally contained 9 mRNA-miRNA pairs (MMP9-miR-132-3p, MMP9-miR-133a-5p, MMP9-miR-29b-3p, MMP9-miR-491-5p, ITGB1-miR-192-5p, ITGB1-miR-29c-3p, ITGB1-miR-29b-3p, ITGB1-miR-9-3p and STAT1-miR-140-5p), 7 miRNA-lncRNA pairs (miR-132-3p-SCAMP1, miR-29b-3p-HCP5, miR-140-5p-HCP5, miR-29c-3p-HCP5, miR-140-5p-MAL2, miR-29b-3p-LINC00511 and miR-29c-3p-LINC00511) and 7 mRNA-lncRNA pairs (MMP9-SCAMP1, MMP9-LINC00511, MMP9-HCP5, ITGB1-HCP5, ITGB1-LINC00511, STAT1-HCP5 and STAT1-MAL2). This network was depicted in Figure 9.
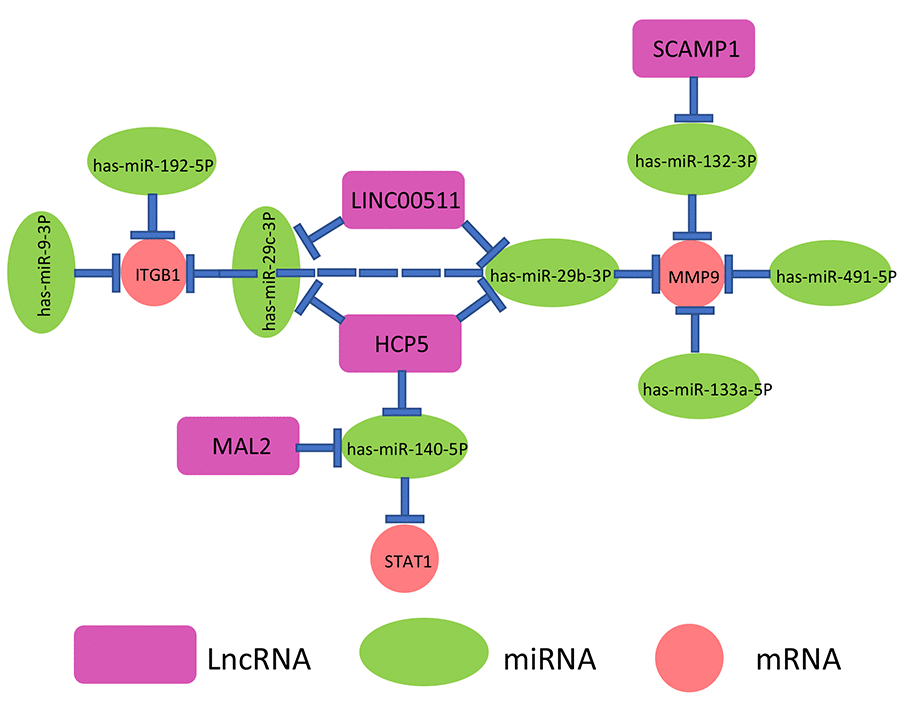
Figure 9. The novel mRNA-miRNA-lncRNA competing endogenous RNA (ceRNA) triple regulatory network associated with prognosis of pancreatic cancer.
As mentioned above, lncRNA can competitively bind to miRNA, thereby relieving suppressive effect of miRNA on mRNA. Based on this hypothesis, there are inverse relationships between miRNAs and lncRNAs or mRNAs and positive associations between mRNAs and lncRNAs. Herein, TCGA pancreatic cancer data were employed to determine the correlations of mRNA-miRNA or miRNA-lncRNA or mRNA-lncRNA pairs in the established network (Figure 9). As shown in Table 2, 6 of 9 mRNA-miRNA pairs (MMP9-miR-132-3p, MMP9-miR-29b-3p, MMP9-miR-491-5p, ITGB1-miR-192-5p, ITGB1-miR-29c-3p, ITGB1-miR-29b-3p), 3 of 7 miRNA-lncRNA pairs (miR-29b-3p-HCP5, miR-140-5p-MAL2 and miR-29c-3p-LINC00511) and 4 of 7 mRNA-lncRNA pairs (MMP9-HCP5, ITGB1-HCP5, STAT1-HCP5 and STAT1-MAL2) were fitted with the ceRNA mechanism. Taken all the three levels into consideration, we constructed a novel mRNA-miRNA-lncRNA triple sub-network, MMP9/ITGB1-miR-29b-3p-HCP5, which is significantly associated with prognosis of pancreatic cancer. The sub-network may also be developed as promising diagnostic biomarkers or therapeutic targets for pancreatic cancer in the future.
Table 2. The correlation between miRNA-mRNA pairs identified by starBase database (The pairs conformed to the ceRNA hypothesis are marked with Bold type).
| miRNA | mRNA | R | P-value |
| miR-132-3p | MMP9 | -0.181 | 1.56e-02 |
| miR-133a-5p | MMP9 | -0.048 | 5.22e-01 |
| miR-29b-3p | MMP9 | -0.202 | 6.80e-03 |
| miR-491-5p | MMP9 | -0.194 | 9.48e-03 |
| miR-192-5p | ITGB1 | -0.223 | 2.80e-03 |
| miR-29c-3p | ITGB1 | -0.443 | 5.82e-10 |
| miR-29b-3p | ITGB1 | -0.440 | 7.78e-10 |
| miR-9-3p | ITGB1 | 0.096 | 2.03e-01 |
| miR-140-5p | STAT1 | 0.016 | 8.34e-01 |
| miRNA | lncRNA | R | P-value |
| miR-132-3p | SCAMP1 | 0.396 | 4.40e-08 |
| miR-29b-3p | HCP5 | -0.163 | 3.00e-02 |
| miR-140-5p | HCP5 | 0.193 | 9.68e-03 |
| miR-29c-3p | HCP5 | 0.009 | 9.01e-01 |
| miR-140-5p | MAL2 | -0.204 | 6.25e-03 |
| miR-29b-3p | LINC00511 | -0.051 | 4.99e-01 |
| miR-29c-3p | LINC00511 | -0.219 | 3.34e-03 |
| mRNA | lncRNA | R | P-value |
| MMP9 | SCAMP1 | -0.129 | 8.57e-02 |
| MMP9 | LINC00511 | 0.061 | 4.16e-01 |
| MMP9 | HCP5 | 0.267 | 3.15e-04 |
| ITGB1 | HCP5 | 0.223 | 2.77e-03 |
| ITGB1 | LINC00511 | 0.046 | 5.45e-01 |
| STAT1 | HCP5 | 0.591 | 3.67e-18 |
| STAT1 | MAL2 | 0.185 | 1.34e-02 |
Discussion
Pancreatic cancer is notorious for its highly lethal nature and poor prognosis. Extremely poor prognosis of patients with pancreatic cancer greatly promotes us to develop effective treatment measures and excavate novel prognostic indicators. Only in these ways can the outcome of pancreatic cancer patients be improved rapidly. Recent studies have suggested that ncRNAs, including miRNAs and lncRNAs, play important roles in cancer initiation and progression [16–20]. After the first proposal of ceRNA hypothesis by Salmena et al. [4], increasing investigations regarding ceRNAs in human cancers have been carried out. For example, Liu et al. suggested that lncRNA XIST/miR-34a axis modulates thyroid cancer proliferation and growth by MET-PI3K-AKT signaling [21]; lncRNA XLOC_ 006390 was found to facilitate cervical cancer tumorigenesis and metastasis as a ceRNA against miR-331-3p and miR-338-3p [22]; Huang et al. found that H19 promoted non-small-cell lung cancer development by STAT3 signaling via sponging miR-17 [23]. In pancreatic cancer, many positive results have been also reported. Gao et al. demonstrated that lncRNA ZEB2-AS1 promoted pancreatic cancer cell growth and invasion by regulation of the miR-204/HMGB1 axis [24]; tumor-derived exosomal lncRNA SOX2OT was also observed to enhance EMT and stemness by acting as a ceRNA in pancreatic cancer [25]; Chen et al. indicated that lncRNA AFAP1-AS1 facilitated pancreatic cancer growth and invasion by upregulating the IGF1R oncogene through sequestration of miR-133a [26]; Gao et al. suggested that lncRNA ROR acted as a ceRNA to modulate Nanog expression by sponging miR-145 and predicted poor prognosis in pancreatic cancer [27]. However, integrated and comprehensive analysis of ceRNAs and mRNAs in pancreatic cancer is still not enough. To the best of our knowledge, this is the first study to investigate the specific ceRNA network in pancreatic cancer by way of “mRNA-miRNA-lncRNA” order pattern, instead of lncRNA-miRNA-mRNA order pattern. Inspiringly, a novel mRNA-miRNA-lncRNA triple regulatory network was constructed and each RNA in this network possessed a significant prognostic value in pancreatic cancer.
In this present study, we identified a total of 914 significant DEGs, consisting of 734 upregulated and 180 downregulated DEGs by intersection of DEGs from two GEO datasets, GSE16515 and GSE15471. GO is widely used as functional enrichment analysis for a large number of genes [28]. The results of these significant DEGs related GO analysis demonstrated that they were significantly enriched in some GO terms that were associated with cancer biological behaviors, including cell adhesion [29], wound healing [30] and activation of MAPK activity [31]. KEGG pathway enrichment analysis revealed that multiple enriched pathways were obtained, primarily involving pathways in cancer and metabolic pathways. Besides, GO analysis and pathway analysis also indicated that these significant DEGs were significantly enriched in focal adhesion. It has been well documented that focal adhesion and cell adhesion play key roles in cancer invasion and metastasis, thereby causing cancer progression [32,33]. Thus, these significant DEGs may be involved in modulation of invasion and metastasis of pancreatic cancer.
To systemically analyze the relationships and functions of significant DEGs in pancreatic cancer, we mapped the DEGs into STRING database and obtained PPI networks. A variety of interactions among these significant DEGs were obtained, especially for the upregulated significant DEGs. It has been widely acknowledged that genes with more node degree in the PPI network usually play more roles. Therefore, we screened the hub genes in the two PPI networks according to node degree. For further identifying key genes in pancreatic cancer, the top ten upregulated and downregulated hub genes were selected for further expression and survival analyses. The analytic results demonstrated that 7 upregulated (MMP9, CXCL8, ACTB, ITGB1, STAT1, TOP2A and CDK1) and 2 downregulated (GNMT and ABAT) hub genes may act as the key genes in pancreatic cancer. Intriguingly, most of these key genes have been well investigated in pancreatic cancer. For example, MMP9 participated in pancreatic cancer angiogenesis and invasion [34,35]; CXCL8 promoted invasiveness and angiogenesis in pancreatic cancer [36]; ITGB1 was upregulated in pancreatic cancer and increased ITGB1 indicated a poor outcome [37]; and STAT1 enhanced pancreatic cancer growth and metastasis [38]. These publications partially support the accuracy of our bioinformatic analyses.
MiRNAs and lncRNAs, are involved in regulation of gene expression and function by ceRNA mechanism as previously described. Some upstream miRNAs of the key genes were first predicted. Survival analysis revealed that patients with higher expression of 8 miRNAs (miR-132-3p, miR-133a-5p, miR-29b-3p, miR-491-5p, miR-192-5p, miR-29c-3p, miR-9-3p and miR-140-5p) have better prognosis in pancreatic cancer. The tumor suppressive roles of the 8 miRNAs in pancreatic cancer have been reported. For example, Abukiwan et al. suggested that inhibition of miR-132-3p drove progression of pancreatic cancer [39]; miR-133a-5p was also found to function as a tumor suppressor in pancreatic cancer [40,41]; the group of Wang Lihua showed that miR-29b-3p decreased proliferation and mobility of pancreatic cancer by targeting SOX12 and DNMT3b [42]. Then, we further predicted 90 upstream lncRNAs of these key miRNAs. By combining expression analysis and survival analysis for these lncRNAs in pancreatic cancer using TCGA data, only 4 lncRNAs (SCAMP1, HCP5, MAL2, LINC00511) were defined as the key lncRNAs. SCAPM1 suppressed migration and invasion of pancreatic cancer [43]; MAL2 expression predicted distant metastasis in pancreatic cancer [44]. Regarding to HCP5 and LINC00511, a variety of studies have also suggested that they act as two crucial oncogenes in human cancers [45,46]. Thus, a prognosis-associated mRNA-miRNA-lncRNA network in pancreatic cancer was successfully established. In this network, some pairs have been identified. For example, Lu et al. demonstrated that miR-29c inhibited pancreatic cancer cell growth, invasion and migration by targeting ITGB1 [47]. These reports further imply the accuracy of our current analytic results. Finally, correlation analysis for the RNA pairs in the constructed mRNA-miRNA-lncRNA network revealed that only MMP9/ITGB1-miR-29b-3p-HCP5 sub-network absolutely conformed to ceRNA hypothesis. Certainly, although attractive findings have been obtained by a series of bioinformatic analyses in our current study, more lab experiments and large-scale clinical trials need to be performed in the future.
Conclusions
In summary, by integrated bioinformatics analysis, we constructed a novel mRNA-miRNA-lncRNA ceRNA triple regulatory network, in which all RNAs possessed significant predictive values for pancreatic cancer prognosis. In addition to the prognostic value of this mRNA-miRNA-lncRNA network in pancreatic cancer, it also provides some key clues for molecular mechanistic investigations of pancreatic cancer in the future. However, our team and other labs should conduct more studies to further validate these findings.
Materials and Methods
MicroRNA microarray
At the first step, we searched for the datasets that compared gene expression between pancreatic cancer tissues and normal tissues in the Gene Expression Omnibus database (http://www.ncbi.nlm.nih.gov/geo/). Only datasets containing more than 15 cancer samples and 15 normal samples were included. Then, the titles and abstracts of these datasets were screened and full information of the datasets of interest were further evaluated. Finally, only two datasets (GSE16515 and GSE15471), based on the platform of Affymetrix Human Genome U133 Plus 2.0 Array (GPL570), were selected for subsequent analyses. GSE16515 dataset contained 36 pancreatic tumor samples and 16 normal samples, and GSE15471 dataset contained 36 pairs of pancreatic cancer tissues and adjacent normal tissues.
Differential expression analysis
The online analytic tool GEO2R (https://www.ncbi.nlm.nih.gov/geo/geo2r), provided by the GEO database, was utilized to obtain DEGs from the two datasets. |log2FC| > 1 and adjusted p-value (adj. p-value) < 0.05 were set as the cut-off criteria when we performed the differential expression analysis. Besides, we employed an online tool, VENNY 2.1.0 (http://bioinfogp.cnb.csic.es/tools/venny/index.html), to draw the Venn diagrams. The DEGs that were commonly appeared in both GSE16515 and GSE15471 datasets were re-defined as the significant DEGs, including upregulated significant DEGs and downregulated significant DEGs.
Gene ontology and KEGG pathway enrichment analysis
Database for Annotation, Visualization, and Integrated Discovery (https://david.ncifcrf.gov/) was introduced to conduct Gene Ontology (GO) functional annotation and Kyoto Encyclopedia of Genes and Genomes (KEGG) pathway enrichment analysis. The enriched GO terms and KEGG pathways were downloaded from the webpage. p-value < 0.05 was considered as statistically significant. Then, the top 10 enriched GO terms and KEGG pathways were displayed using ggplot2 package of R software [48].
Protein-protein interaction (PPI) network
The PPI interaction networks between the DEGs were constructed by Search Tool for the Retrieval of Interacting Genes (STRING) database (http://string-db.org/) [49]. Firstly, the DEGs were typed into the database. Then, high-resolution bitmaps were displayed and downloaded from the webpage. Only these interactors with combined confidence score >= 0.4 were shown in the bitmap.
Identification of hub genes
By calculating the degree of connectivity as we previously reported [50–52], the hub genes in the PPI networks were identified using CytoHubba, a plugin in Cytoscape software (Version 3.6.1). According to node degree, the top 30 hub genes were displayed in the Cytoscape software (Version 3.6.1).
Gene expression analysis
In the TCGA project, there are only 4 pancreatic normal samples, which are too small sample size for performing the comparison between pancreatic cancer and normal controls. Gene Expression Profiling Interactive Analysis (GEPIA) (http://gepia.cancer-pku.cn/detail.php) is a newly developed interactive web server for analyzing the RNA sequencing expression data of 9736 tumors and 8587 normal samples from the TCGA and the GTEx projects [53]. In this study, GEPIA database, containing 179 pancreatic cancer samples and 171 normal samples, was used to analyze expression levels of key genes and lncRNAs in pancreatic cancer. Genes with |log2FC| > 1 and p-value < 0.05 were considered as statistically significant.
Survival analysis
Prognostic values of genes, miRNAs and lncRNAs in pancreatic cancer were analyzed using Kaplan-Meier plotter database, which is capable to assess the effect of 54675 genes on survival using 10461 cancer samples [54]. Pancreatic cancer mRNA RNA-seq and miRNA data from “Pan-cancer” item in Kaplan-Meier plotter database were selected. These genes, miRNAs and lncRNAs were first entered into the database. Then, the hazard ratio (HR) with 95% confidence interval and logrank p-value were automatically calculated and directly displayed on the webpage. Logrank p-value < 0.05 was regarded as statistically significant.
Prediction of miRNA
Upstream miRNAs of key genes were predicted using miRTarbase database [55]. In miRTarbase database, the collected microRNA-target interactions are experimentally validated by reporter assay, western blot, qPCR, microarray and next-generation sequencing experiments. To obtain more accurate prediction results, in this study, we only included microRNA-target interactions that were validated by reporter assay. Prognostic values of these predicted miRNAs were further assessed using Kaplan-Meier plotter database as mentioned above.
Prediction of lncRNA
In this study, miRNet database was used to predict the upstream lncRNAs of miRNAs, which is a an easy-to-use tool for miRNA-associated studies [56,57]. “Organism-H.sapies”, “Tissue-Pancreas” and “target type-lncRNAs” were set as selection criteria.
Correlation analysis
The correlations of mRNA-miRNA, miRNA-lncRNA and mRNA-lncRNA pairs in pancreatic cancer were evaluated using starBase database, which is an open-source platform for studying the ncRNA interactions from CLIP-seq, degradome-seq and RNA-RNA interactome data [58,59]. p-value < 0.05 was considered as statistically significant.
Availability of data and materials
Please contact author for data and materials requests.
Supplementary Materials
Conflicts of Interest
The authors declare that they have no conflicts of interest.
Funding
This work was supported by the National Natural Science Foundation of China (81372462, 81572987).
References
- 1. Shah A, Korrapati P, Siegel J, Kasmin F. Rare metastasis of primary pancreatic adenocarcinoma to the bladder. ACG Case Rep J. 2018; 5:e27. https://doi.org/10.14309/crj.2018.27 [PubMed]
- 2. Lin QJ, Yang F, Jin C, Fu DL. Current status and progress of pancreatic cancer in China. World J Gastroenterol. 2015; 21:7988–8003. https://doi.org/10.3748/wjg.v21.i26.7988 [PubMed]
- 3. Mohammed S, Van Buren G
2nd , Fisher WE. Pancreatic cancer: advances in treatment. World J Gastroenterol. 2014; 20:9354–60. [PubMed] - 4. Salmena L, Poliseno L, Tay Y, Kats L, Pandolfi PP. A ceRNA hypothesis: the Rosetta Stone of a hidden RNA language? Cell. 2011; 146:353–58. https://doi.org/10.1016/j.cell.2011.07.014 [PubMed]
- 5. Karreth FA, Pandolfi PP. ceRNA cross-talk in cancer: when ce-bling rivalries go awry. Cancer Discov. 2013; 3:1113–21. https://doi.org/10.1158/2159-8290.CD-13-0202 [PubMed]
- 6. Guttman M, Amit I, Garber M, French C, Lin MF, Feldser D, Huarte M, Zuk O, Carey BW, Cassady JP, Cabili MN, Jaenisch R, Mikkelsen TS, et al. Chromatin signature reveals over a thousand highly conserved large non-coding RNAs in mammals. Nature. 2009; 458:223–27. https://doi.org/10.1038/nature07672 [PubMed]
- 7. Jiao D, Li Z, Zhu M, Wang Y, Wu G, Han X. LncRNA MALAT1 promotes tumor growth and metastasis by targeting miR-124/foxq1 in bladder transitional cell carcinoma (BTCC). Am J Cancer Res. 2018; 8:748–60. [PubMed]
- 8. Yao J, Li Z, Yang Z, Xue H, Chang H, Zhang X, Li T, Guo K. Long noncoding RNA TOB1-AS1, an epigenetically silenced gene, functioned as a novel tumor suppressor by sponging miR-27b in cervical cancer. Am J Cancer Res. 2018; 8:1483–98. [PubMed]
- 9. Zhang J, Li W. Long noncoding RNA CYTOR sponges miR-195 to modulate proliferation, migration, invasion and radiosensitivity in nonsmall cell lung cancer cells. Biosci Rep. 2018; 38:BSR20181599. https://doi.org/10.1042/BSR20181599 [PubMed]
- 10. Fan CN, Ma L, Liu N. Systematic analysis of lncRNA-miRNA-mRNA competing endogenous RNA network identifies four-lncRNA signature as a prognostic biomarker for breast cancer. J Transl Med. 2018; 16:264. https://doi.org/10.1186/s12967-018-1640-2 [PubMed]
- 11. Wang P, Li J, Zhao W, Shang C, Jiang X, Wang Y, Zhou B, Bao F, Qiao H. A Novel LncRNA-miRNA-mRNA triple network identifies LncRNA RP11-363E7.4 as an important regulator of miRNA and gene expression in gastric cancer. Cell Physiol Biochem. 2018; 47:1025–41. https://doi.org/10.1159/000490168 [PubMed]
- 12. Yan H, Wang Q, Shen Q, Li Z, Tian J, Jiang Q, Gao L. Identification of potential transcription factors, long noncoding RNAs, and microRNAs associated with hepatocellular carcinoma. J Cancer Res Ther. 2018 (Suppl ); 14:S622–27. https://doi.org/10.4103/0973-1482.204846 [PubMed]
- 13. Sun Y, Zhu Q, Yang W, Shan Y, Yu Z, Zhang Q, Wu H. LncRNA H19/miR-194/PFTK1 axis modulates the cell proliferation and migration of pancreatic cancer. J Cell Biochem. 2019; 120:3874–86. https://doi.org/10.1002/jcb.27669 [PubMed]
- 14. Militello G, Weirick T, John D, Döring C, Dimmeler S, Uchida S. Screening and validation of lncRNAs and circRNAs as miRNA sponges. Brief Bioinform. 2017; 18:780–88. https://doi.org/10.1093/bib/bbw053 [PubMed]
- 15. Song J, Ye A, Jiang E, Yin X, Chen Z, Bai G, Zhou Y, Liu J. Reconstruction and analysis of the aberrant lncRNA-miRNA-mRNA network based on competitive endogenous RNA in CESC. J Cell Biochem. 2018; 119:6665–73. https://doi.org/10.1002/jcb.26850 [PubMed]
- 16. Chan JJ, Tay Y. Noncoding RNA:RNA Regulatory Networks in Cancer. Int J Mol Sci. 2018; 19:E1310. https://doi.org/10.3390/ijms19051310 [PubMed]
- 17. Ding B, Lou W, Xu L, Fan W. Non-coding RNA in drug resistance of hepatocellular carcinoma. Biosci Rep. 2018; 38:BSR20180915. https://doi.org/10.1042/BSR20180915 [PubMed]
- 18. Lou W, Liu J, Gao Y, Zhong G, Chen D, Shen J, Bao C, Xu L, Pan J, Cheng J, Ding B, Fan W. MicroRNAs in cancer metastasis and angiogenesis. Oncotarget. 2017; 8:115787–802. https://doi.org/10.18632/oncotarget.23115 [PubMed]
- 19. Lou W, Liu J, Gao Y, Zhong G, Ding B, Xu L, Fan W. MicroRNA regulation of liver cancer stem cells. Am J Cancer Res. 2018; 8:1126–41. [PubMed]
- 20. Xu N, Wu YP, Yin HB, Xue XY, Gou X. Molecular network-based identification of competing endogenous RNAs and mRNA signatures that predict survival in prostate cancer. J Transl Med. 2018; 16:274. https://doi.org/10.1186/s12967-018-1637-x [PubMed]
- 21. Liu H, Deng H, Zhao Y, Li C, Liang Y. LncRNA XIST/miR-34a axis modulates the cell proliferation and tumor growth of thyroid cancer through MET-PI3K-AKT signaling. J Exp Clin Cancer Res. 2018; 37:279. https://doi.org/10.1186/s13046-018-0950-9 [PubMed]
- 22. Luan X, Wang Y. LncRNA XLOC_006390 facilitates cervical cancer tumorigenesis and metastasis as a ceRNA against miR-331-3p and miR-338-3p. J Gynecol Oncol. 2018; 29:e95. https://doi.org/10.3802/jgo.2018.29.e95 [PubMed]
- 23. Huang Z, Lei W, Hu HB, Zhang H, Zhu Y. H19 promotes non-small-cell lung cancer (NSCLC) development through STAT3 signaling via sponging miR-17. J Cell Physiol. 2018; 233:6768–76. https://doi.org/10.1002/jcp.26530 [PubMed]
- 24. Gao H, Gong N, Ma Z, Miao X, Chen J, Cao Y, Zhang G. LncRNA ZEB2-AS1 promotes pancreatic cancer cell growth and invasion through regulating the miR-204/HMGB1 axis. Int J Biol Macromol. 2018; 116:545–51. https://doi.org/10.1016/j.ijbiomac.2018.05.044 [PubMed]
- 25. Li Z, Jiang P, Li J, Peng M, Zhao X, Zhang X, Chen K, Zhang Y, Liu H, Gan L, Bi H, Zhen P, Zhu J, Li X. Tumor-derived exosomal lnc-Sox2ot promotes EMT and stemness by acting as a ceRNA in pancreatic ductal adenocarcinoma. Oncogene. 2018; 37:3822–38. https://doi.org/10.1038/s41388-018-0237-9 [PubMed]
- 26. Chen B, Li Q, Zhou Y, Wang X, Zhang Q, Wang Y, Zhuang H, Jiang X, Xiong W. The long coding RNA AFAP1-AS1 promotes tumor cell growth and invasion in pancreatic cancer through upregulating the IGF1R oncogene via sequestration of miR-133a. Cell Cycle. 2018; 17:1949–66. https://doi.org/10.1080/15384101.2018.1496741 [PubMed]
- 27. Gao S, Wang P, Hua Y, Xi H, Meng Z, Liu T, Chen Z, Liu L. ROR functions as a ceRNA to regulate Nanog expression by sponging miR-145 and predicts poor prognosis in pancreatic cancer. Oncotarget. 2016; 7:1608–18. https://doi.org/10.18632/oncotarget.6450 [PubMed]
- 28. Ashburner M, Ball CA, Blake JA, Botstein D, Butler H, Cherry JM, Davis AP, Dolinski K, Dwight SS, Eppig JT, Harris MA, Hill DP, Issel-Tarver L, et al, and The Gene Ontology Consortium. Gene ontology: tool for the unification of biology. Nat Genet. 2000; 25:25–29. https://doi.org/10.1038/75556 [PubMed]
- 29. Jacquemet G, Hamidi H, Ivaska J. Filopodia in cell adhesion, 3D migration and cancer cell invasion. Curr Opin Cell Biol. 2015; 36:23–31. https://doi.org/10.1016/j.ceb.2015.06.007 [PubMed]
- 30. Rybinski B, Franco-Barraza J, Cukierman E. The wound healing, chronic fibrosis, and cancer progression triad. Physiol Genomics. 2014; 46:223–44. https://doi.org/10.1152/physiolgenomics.00158.2013 [PubMed]
- 31. Wagner EF, Nebreda AR. Signal integration by JNK and p38 MAPK pathways in cancer development. Nat Rev Cancer. 2009; 9:537–49. https://doi.org/10.1038/nrc2694 [PubMed]
- 32. Duperret EK, Dahal A, Ridky TW. Focal-adhesion-independent integrin-αv regulation of FAK and c-Myc is necessary for 3D skin formation and tumor invasion. J Cell Sci. 2015; 128:3997–4013. https://doi.org/10.1242/jcs.175539 [PubMed]
- 33. Eke I, Cordes N. Focal adhesion signaling and therapy resistance in cancer. Semin Cancer Biol. 2015; 31:65–75. https://doi.org/10.1016/j.semcancer.2014.07.009 [PubMed]
- 34. Arnold S, Mira E, Muneer S, Korpanty G, Beck AW, Holloway SE, Mañes S, Brekken RA. Forced expression of MMP9 rescues the loss of angiogenesis and abrogates metastasis of pancreatic tumors triggered by the absence of host SPARC. Exp Biol Med (Maywood). 2008; 233:860–73. https://doi.org/10.3181/0801-RM-12 [PubMed]
- 35. Puolakkainen P, Koski A, Vainionpää S, Shen Z, Repo H, Kemppainen E, Mustonen H, Seppänen H. Anti-inflammatory macrophages activate invasion in pancreatic adenocarcinoma by increasing the MMP9 and ADAM8 expression. Med Oncol. 2014; 31:884. https://doi.org/10.1007/s12032-014-0884-9 [PubMed]
- 36. Matsuo Y, Ochi N, Sawai H, Yasuda A, Takahashi H, Funahashi H, Takeyama H, Tong Z, Guha S. CXCL8/IL-8 and CXCL12/SDF-1alpha co-operatively promote invasiveness and angiogenesis in pancreatic cancer. Int J Cancer. 2009; 124:853–61. https://doi.org/10.1002/ijc.24040 [PubMed]
- 37. Van den Broeck A, Vankelecom H, Van Eijsden R, Govaere O, Topal B. Molecular markers associated with outcome and metastasis in human pancreatic cancer. J Exp Clin Cancer Res. 2012; 31:68. https://doi.org/10.1186/1756-9966-31-68 [PubMed]
- 38. Seshacharyulu P, Ponnusamy MP, Rachagani S, Lakshmanan I, Haridas D, Yan Y, Ganti AK, Batra SK. Targeting EGF-receptor(s) - STAT1 axis attenuates tumor growth and metastasis through downregulation of MUC4 mucin in human pancreatic cancer. Oncotarget. 2015; 6:5164–81. https://doi.org/10.18632/oncotarget.3286 [PubMed]
- 39. Abukiwan A, Nwaeburu CC, Bauer N, Zhao Z, Liu L, Gladkich J, Gross W, Benner A, Strobel O, Fellenberg J, Herr I. Dexamethasone-induced inhibition of miR-132 via methylation promotes TGF-β-driven progression of pancreatic cancer. Int J Oncol. 2019; 54:53–64. https://doi.org/10.3892/ijo.2018.4616 [PubMed]
- 40. Chen B, Li Q, Zhou Y, Wang X, Zhang Q, Wang Y, Zhuang H, Jiang X, Xiong W. The long coding RNA AFAP1-AS1 promotes tumor cell growth and invasion in pancreatic cancer through upregulating the IGF1R oncogene via sequestration of miR-133a. Cell Cycle. 2018; 17:1949–66. https://doi.org/10.1080/15384101.2018.1496741 [PubMed]
- 41. Qin Y, Dang X, Li W, Ma Q. miR-133a functions as a tumor suppressor and directly targets FSCN1 in pancreatic cancer. Oncol Res. 2013; 21:353–63. https://doi.org/10.3727/096504014X14024160459122 [PubMed]
- 42. Wang L, Wang Z, Huang L, Wu C, Zhang B. MiR-29b suppresses proliferation and mobility by targeting SOX12 and DNMT3b in pancreatic cancer. Anticancer Drugs. 2019; 30:281–88. https://doi.org/10.1097/CAD.0000000000000719 [PubMed]
- 43. Yang S, Lee KT, Lee JY, Lee JK, Lee KH, Rhee JC. Inhibition of SCAMP1 suppresses cell migration and invasion in human pancreatic and gallbladder cancer cells. Tumour Biol. 2013; 34:2731–39. https://doi.org/10.1007/s13277-013-0825-9 [PubMed]
- 44. Eguchi D, Ohuchida K, Kozono S, Ikenaga N, Shindo K, Cui L, Fujiwara K, Akagawa S, Ohtsuka T, Takahata S, Tokunaga S, Mizumoto K, Tanaka M. MAL2 expression predicts distant metastasis and short survival in pancreatic cancer. Surgery. 2013; 154:573–82. https://doi.org/10.1016/j.surg.2013.03.010 [PubMed]
- 45. Lu G, Li Y, Ma Y, Lu J, Chen Y, Jiang Q, Qin Q, Zhao L, Huang Q, Luo Z, Huang S, Wei Z. Long noncoding RNA LINC00511 contributes to breast cancer tumourigenesis and stemness by inducing the miR-185-3p/E2F1/Nanog axis. J Exp Clin Cancer Res. 2018; 37:289. https://doi.org/10.1186/s13046-018-0945-6 [PubMed]
- 46. Zhao W, Li L. SP1-induced upregulation of long non-coding RNA HCP5 promotes the development of osteosarcoma. Pathol Res Pract. 2019; 215:439–45. https://doi.org/10.1016/j.prp.2018.12.006 [PubMed]
- 47. Lu Y, Hu J, Sun W, Li S, Deng S, Li M. MiR-29c inhibits cell growth, invasion, and migration of pancreatic cancer by targeting ITGB1. Onco Targets Ther. 2015; 9:99–109. https://doi.org/10.2147/OTT.S92758 [PubMed]
- 48. Maag JL. gganatogram: an R package for modular visualisation of anatograms and tissues based on ggplot2. F1000Res. 2018; 7:1576. https://doi.org/10.12688/f1000research.16409.1 [PubMed]
- 49. Szklarczyk D, Franceschini A, Kuhn M, Simonovic M, Roth A, Minguez P, Doerks T, Stark M, Muller J, Bork P, Jensen LJ, von Mering C. The STRING database in 2011: functional interaction networks of proteins, globally integrated and scored. Nucleic Acids Res. 2011; 39:D561–68. https://doi.org/10.1093/nar/gkq973 [PubMed]
- 50. Lou W, Chen J, Ding B, Chen D, Zheng H, Jiang D, Xu L, Bao C, Cao G, Fan W. Identification of invasion-metastasis-associated microRNAs in hepatocellular carcinoma based on bioinformatic analysis and experimental validation. J Transl Med. 2018; 16:266. https://doi.org/10.1186/s12967-018-1639-8 [PubMed]
- 51. Lou W, Liu J, Ding B, Xu L, Fan W. Identification of chemoresistance-associated miRNAs in breast cancer. Cancer Manag Res. 2018; 10:4747–57. https://doi.org/10.2147/CMAR.S172722 [PubMed]
- 52. Tang D, Zhao X, Zhang L, Wang Z, Wang C. Identification of hub genes to regulate breast cancer metastasis to brain by bioinformatics analyses. J Cell Biochem. 2019; 120:9522–31. https://doi.org/10.1002/jcb.28228 [PubMed]
- 53. Tang Z, Li C, Kang B, Gao G, Li C, Zhang Z. GEPIA: a web server for cancer and normal gene expression profiling and interactive analyses. Nucleic Acids Res. 2017; 45:W98–102. https://doi.org/10.1093/nar/gkx247 [PubMed]
- 54. Lánczky A, Nagy Á, Bottai G, Munkácsy G, Szabó A, Santarpia L, Győrffy B. miRpower: a web-tool to validate survival-associated miRNAs utilizing expression data from 2178 breast cancer patients. Breast Cancer Res Treat. 2016; 160:439–46. https://doi.org/10.1007/s10549-016-4013-7 [PubMed]
- 55. Chou CH, Shrestha S, Yang CD, Chang NW, Lin YL, Liao KW, Huang WC, Sun TH, Tu SJ, Lee WH, Chiew MY, Tai CS, Wei TY, et al. miRTarBase update 2018: a resource for experimentally validated microRNA-target interactions. Nucleic Acids Res. 2018; 46:D296–302. https://doi.org/10.1093/nar/gkx1067 [PubMed]
- 56. Fan Y, Siklenka K, Arora SK, Ribeiro P, Kimmins S, Xia J. miRNet - dissecting miRNA-target interactions and functional associations through network-based visual analysis. Nucleic Acids Res. 2016; 44:W135-41. https://doi.org/10.1093/nar/gkw288 [PubMed]
- 57. Fan Y, Xia J. miRNet-Functional Analysis and Visual Exploration of miRNA-Target Interactions in a Network Context. Methods Mol Biol. 2018; 1819:215–33. https://doi.org/10.1007/978-1-4939-8618-7_10 [PubMed]
- 58. Li JH, Liu S, Zhou H, Qu LH, Yang JH. starBase v2.0: decoding miRNA-ceRNA, miRNA-ncRNA and protein-RNA interaction networks from large-scale CLIP-Seq data. Nucleic Acids Res. 2014; 42:D92–97. https://doi.org/10.1093/nar/gkt1248 [PubMed]
- 59. Yang JH, Li JH, Shao P, Zhou H, Chen YQ, Qu LH. starBase: a database for exploring microRNA-mRNA interaction maps from Argonaute CLIP-Seq and Degradome-Seq data. Nucleic Acids Res. 2011 (suppl_1); 39:D202–09. https://doi.org/10.1093/nar/gkq1056 [PubMed]