


Introduction
In different countries, the incidence rates (cases/100,000 people) of hepatocellular carcinoma (HCC) range from 1.9 to 41.3 among males and from 0.8 to 13.9 among females [1]. Globally, HCC is the second most common cause of cancer-related death and is estimated to have been responsible for nearly 745,000 deaths in 2012 [2]. Regarding the diagnosis and screening of HCC, although there are multiple traditional methods, including ultrasound imaging (UI), computer tomography (CT) imaging, magnetic resonance imaging (MRI) and the measurement of serum alpha-fetoprotein (AFP) levels and other potential biomarkers, such as glypican-3 (GPC3), dickkopf-1 (DKK1) and circulating miRNAs, early diagnosis with high specificity and sensitivity remains difficult; 70–80% of patients are in advanced stages by the time they present symptoms and therefore miss the opportunity to receive radical resection [3], which is especially common in China [4]. Consequently, the five-year overall survival (OS) rate of HCC patients after initial diagnosis is lower than 20%. Therefore, developing a better biomarker with high specificity and sensitivity for early diagnosis and prognosis is important.
Ras homolog gene family, member A (RhoA) is a small GTPase protein in the Rho family containing two switch regions, Switch I and Switch II, whose conformational states are modified following the activation or deactivation of the protein. The key amino acids of RhoA at Gly14, Thr19, Phe30, and Gln63, which are involved in the stabilization and regulation of guanosine triphosphate (GTP) hydrolysis, are highly conserved. RhoA is primarily involved in actin organization, myosin contractility, cell cycle maintenance, cellular morphological polarization, cellular development, and transcriptional control. Accumulated evidence has demonstrated that RhoA was closely associated with cancer in relation to venous invasion, microscopic satellite lesions, advanced pTNM stage, progression [5], cell differentiation [6] and disease-free survival rates [7]. However, the prognostic and diagnostic value of RhoA in HCC is still unclear, and further research is urgently needed.
Here, using bioinformatics data mining, we found that both the gene and protein levels of RhoA were differentially expressed between liver cancer tissues and adjacent normal tissues, which indicated the potential of RhoA as a diagnostic biomarker. Analysis of The Cancer Genome Atlas (TCGA) data suggested that higher RhoA gene expression was associated with poorer prognosis, and similar patterns were also observed in two additional Gene Expression Omnibus (GEO) cohorts. The protein expression, but not the mRNA level, of RhoA varied greatly between liver cancer tissues and normal tissues, making it possible to build not only a prognostic model but also a diagnostic model, which was validated in a Peking Union Medical College Hospital (PUMCH) cohort with 30 normal tissue samples and 134 HCC samples.
Results
mRNA and protein expression profile of RhoA in the HPA
By examining the RhoA expression profile in the HPA, we found that the RNA expression of RhoA in the normal liver tissue samples was the lowest compared with that in the other 30 human tissue samples (Figure 1A), and the protein level of RhoA was nearly undetectable in hepatic tissues (Figure 1B). As Figure 1C shows, the level of RhoA in the HCC tissue samples was relatively low among the 17 carcinoma types; however, the expression of RhoA was found to be significantly upregulated in HCC tissues compared with that in normal tissues (Figure 1D). Interestingly, regarding RhoA protein expression, liver cancer exhibited a high positive rate, which ranked second among the positive expression rates of 20 common cancer types (Figure 1E). Figure 1F displays representative IHC images of the distinct RhoA expression levels, including undetected, low, and medium. In addition, Hep G2, which is a frequently used hepatic carcinoma cell line, had a similar RhoA expression pattern as that of the liver cancer tissue shown in Figure 1C, as identified by the Cancer Cell Line Encyclopedia (CCLE) web searching tool. Hence, the RhoA protein level, rather than the gene expression level, may be a more sensitive biomarker to diagnose HCC.
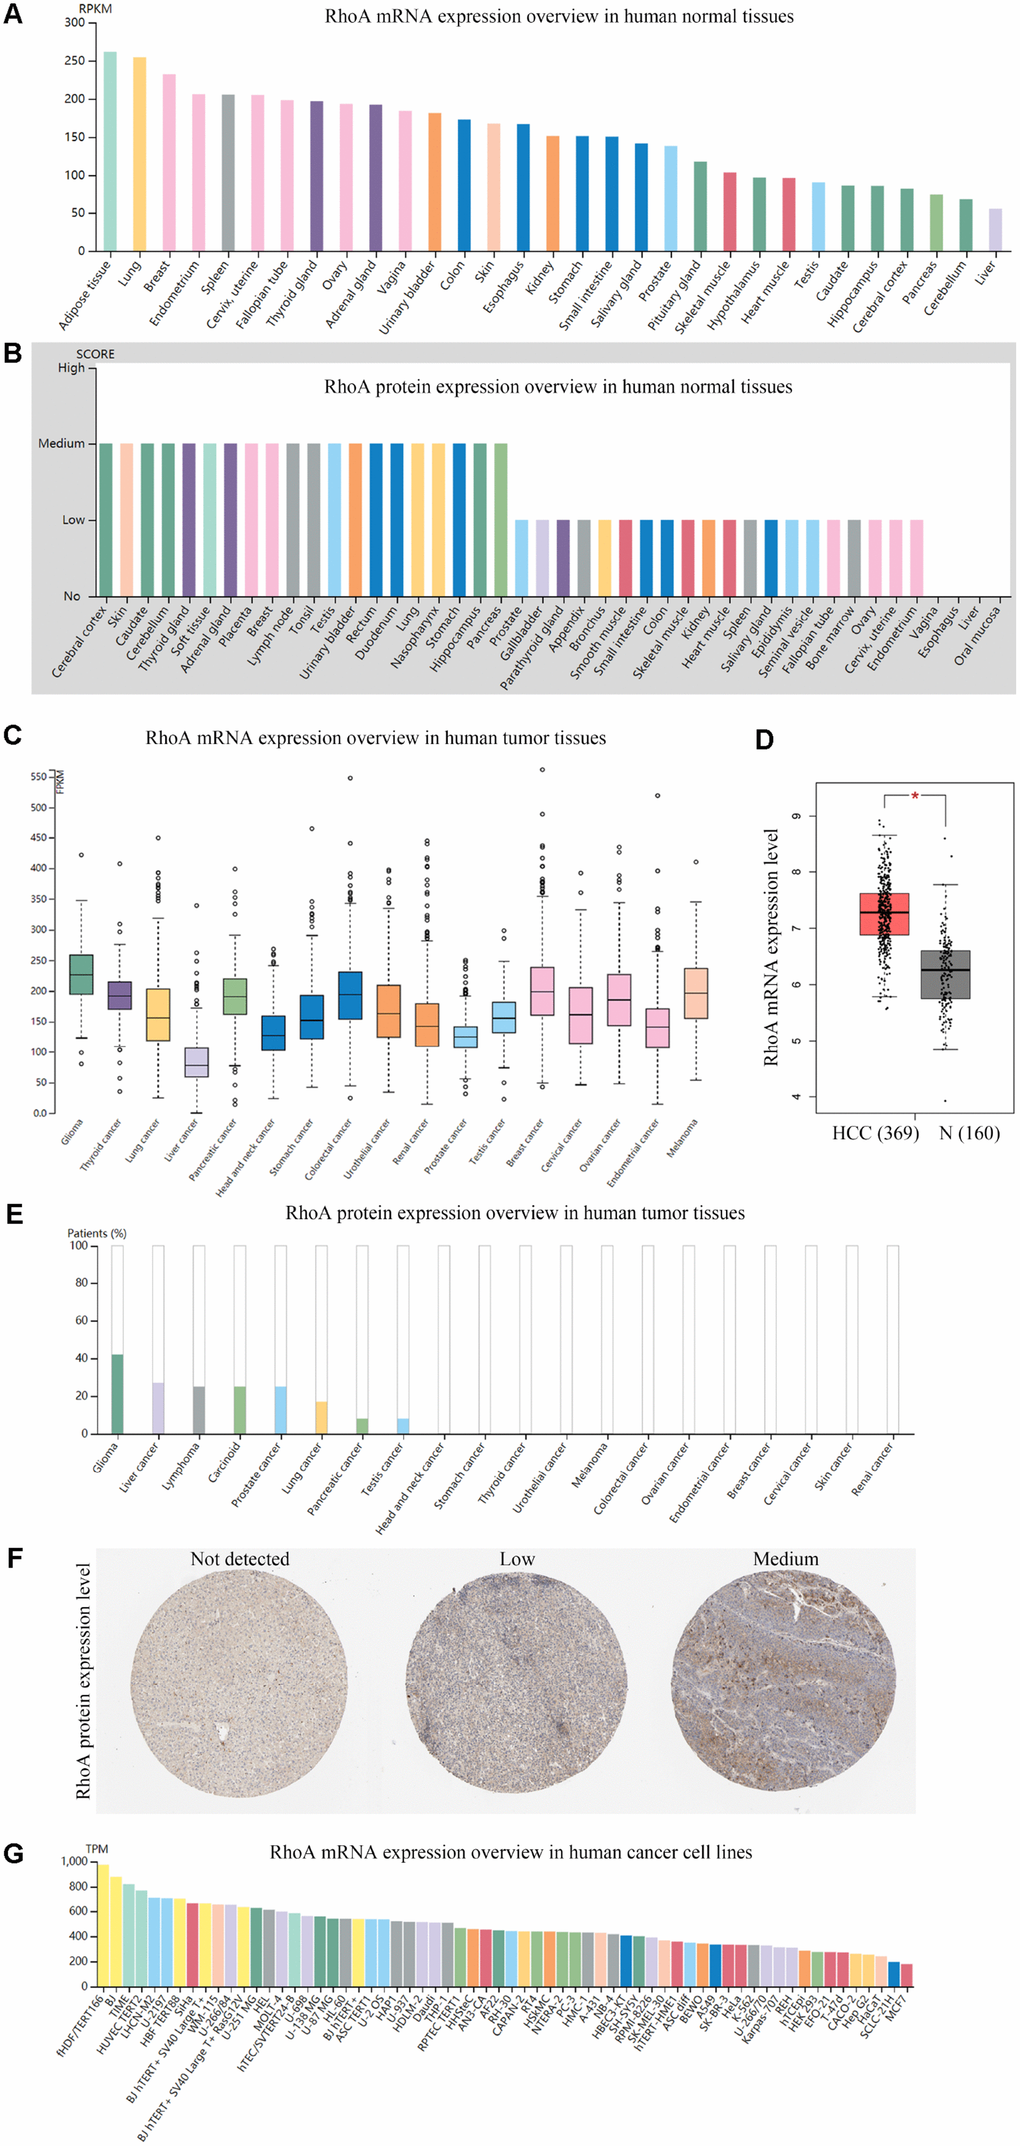
Figure 1. Gene and protein expression profiles of RhoA in tissue samples and cancer cell lines.RhoA mRNA expression (A) data from the GTEx dataset in the Human Protein Atlas) and protein expression (B) data from the Human Protein Atlas) in normal human tissues. RhoA gene expression in common human tumor tissues (C) data from the TCGA dataset in the Human Protein Atlas). Comparison of RhoA mRNA expression between hepatocellular carcinoma tissues and normal liver tissues, including normal TCGA and GTEx data (D) data from GEPIA). RhoA protein expression overview in human tumor tissues (E) data from the TCGA CAB005052 dataset in the Human Protein Atlas) and representative immunohistochemistry (IHC) images (F) pictures from the Human Protein Atlas) with RhoA antibody (1:25, Cat#1600-1, Abcam, Cambridge, UK). RhoA mRNA expression in human cancer cell lines (G, data from RNA cell line category in the Human Protein Atlas).
Prognostic role of RhoA gene expression in liver cancer patients
To explore the association between RhoA mRNA expression and OS in liver cancer patients, we performed Kaplan-Meier survival analysis based on data from TCGA. The results indicated that the HCC patients with high RhoA expression had poorer prognoses (Figure 2A). Notably, the optimal cutoff point of RhoA mRNA expression was calculated based on the X-tile method, which can produce the optimal cutoff value to predict survival time (Figure 2B). Moreover, the tumor-promoting role of RhoA was also demonstrated by two genomic spatial event (GSE) datasets (GSE10186 and GSE 54236), in which the P values were 0.039 and 0.024, respectively (Figure 2C and Figure 2D).
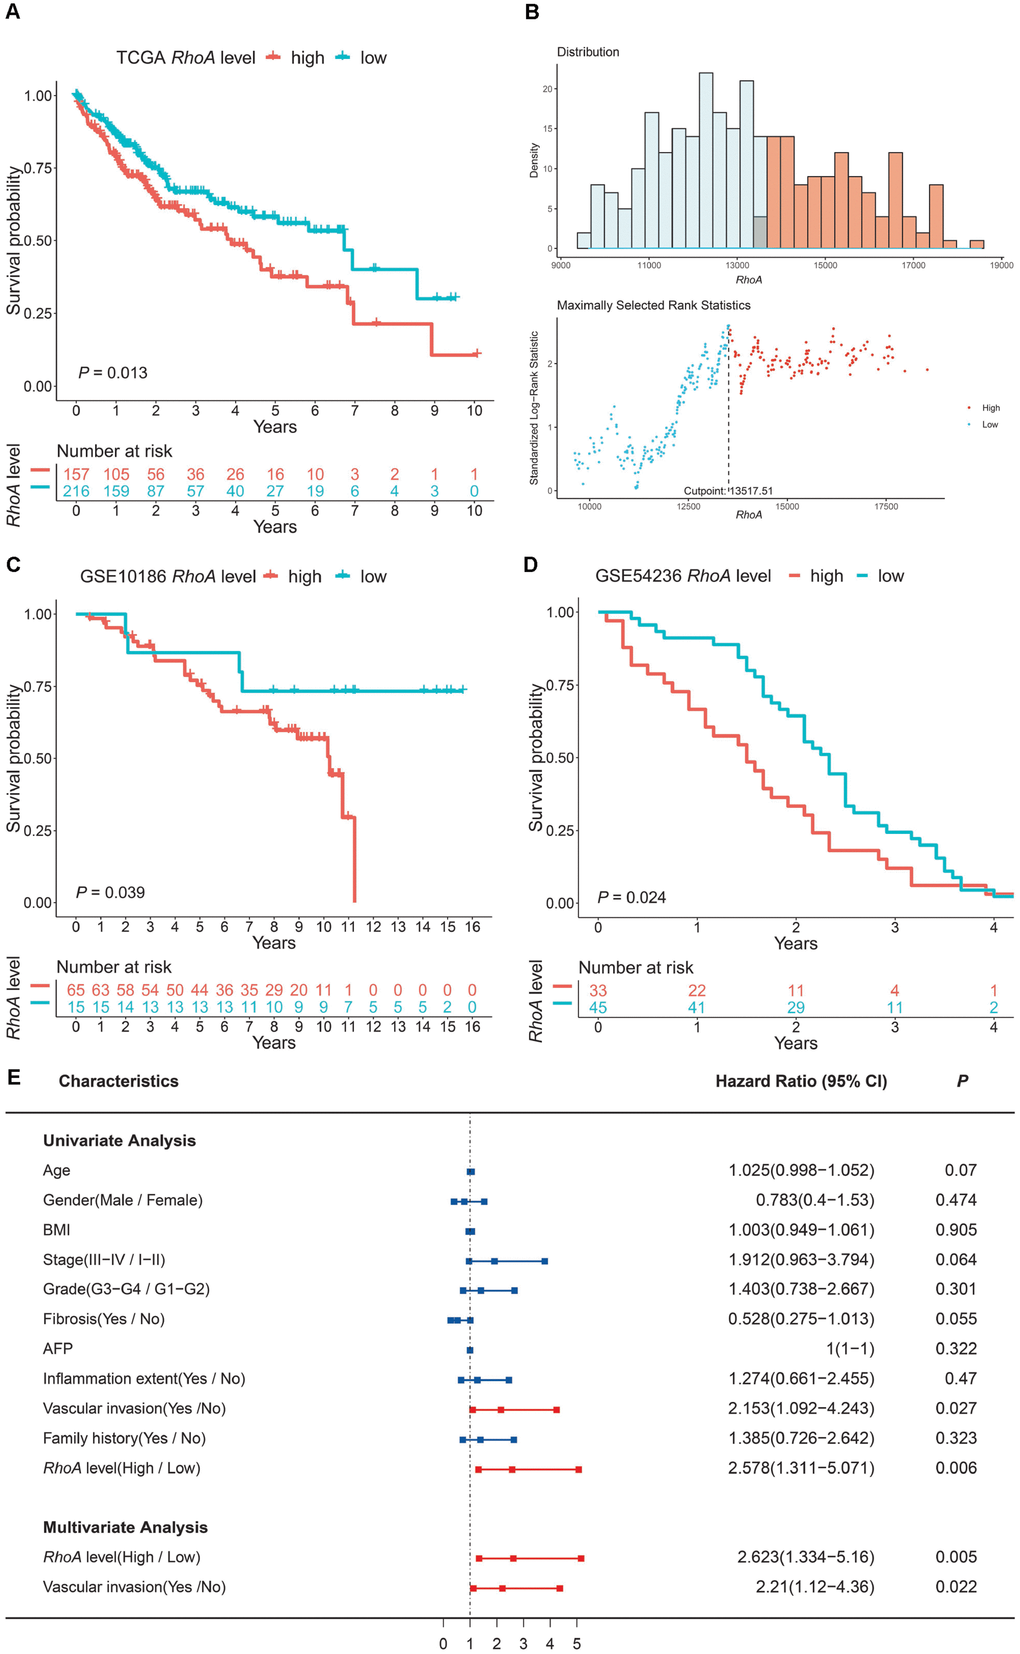
Figure 2. RhoA expression level as an independent prognostic factor in HCC. The high expression level of RhoA suggests poor prognosis based on the TCGA training set (A), and the optimal cutoff point was calculated via the X-tile method (B). High RhoA expression levels were also unfavorable in two GEO validation sets (C, GSE10186; D, GSE54236). Univariate and multivariate Cox regression analyses of clinical indicators and RhoA levels related to prognosis: red bars represent prognostic factors, and blue bars represent nonprognostic factors (E).
To further investigate the independent prognostic value of RhoA, univariate and multivariate Cox regression analyses were conducted. As shown in Figure 2E, vascular invasion (HR: 1.274; 95% CI: 1.092–4.243, P = 0.027; Figure 2E) and high RhoA levels (HR: 2.578; 95% CI: 1.311–5.071, P = 0.006; Figure 2E) were associated with poor OS in the univariate analysis. In addition, multivariate analysis also demonstrated that the aforementioned factors were independent risk factors of OS (P < 0.05; Figure 2E).
RhoA expression is associated with gender
Next, we divided HCC patients from TCGA into a high-risk group and a low-risk group according to the optimal cutoff value of RhoA expression mentioned before to explore the relationships of RhoA expression with different clinicopathological parameters, and we only found that male patients had significantly higher RhoA gene expression levels than female patients (Table 1, Supplementary Table 1, and Figure 3A). However, the other clinical characteristics, such as different stage levels or grade levels of HCC, seemed to have no influence on RhoA expression levels (Table 1, Supplementary Table 1, Figure 3B, 3C).
Table 1. The association between RhoA expression and the clinical parameters of patients with liver cancer.
| RhoA level | |||||||||||||||||||||||||||||||||||||||||||||||||||||||||||||||||||||||||||||||||||||||||||||||||||
| Categorical variable | Low(N=216) | High(N=157) | Chi-square or F value | P value | |||||||||||||||||||||||||||||||||||||||||||||||||||||||||||||||||||||||||||||||||||||||||||||||
| Gender | |||||||||||||||||||||||||||||||||||||||||||||||||||||||||||||||||||||||||||||||||||||||||||||||||||
| Female | 86 | 35 | 11.949 | 0.0005467 | |||||||||||||||||||||||||||||||||||||||||||||||||||||||||||||||||||||||||||||||||||||||||||||||
| Male | 130 | 122 | |||||||||||||||||||||||||||||||||||||||||||||||||||||||||||||||||||||||||||||||||||||||||||||||||
| Stage | |||||||||||||||||||||||||||||||||||||||||||||||||||||||||||||||||||||||||||||||||||||||||||||||||||
| I-II | 153 | 106 | 0.21049 | 0.6464 | |||||||||||||||||||||||||||||||||||||||||||||||||||||||||||||||||||||||||||||||||||||||||||||||
| III-IVB | 50 | 40 | |||||||||||||||||||||||||||||||||||||||||||||||||||||||||||||||||||||||||||||||||||||||||||||||||
| Grade | |||||||||||||||||||||||||||||||||||||||||||||||||||||||||||||||||||||||||||||||||||||||||||||||||||
| G1-G2 | 143 | 90 | 2.3593 | 0.1245 | |||||||||||||||||||||||||||||||||||||||||||||||||||||||||||||||||||||||||||||||||||||||||||||||
| G3-G4 | 71 | 64 | |||||||||||||||||||||||||||||||||||||||||||||||||||||||||||||||||||||||||||||||||||||||||||||||||
| Fibrosis | |||||||||||||||||||||||||||||||||||||||||||||||||||||||||||||||||||||||||||||||||||||||||||||||||||
| No | 48 | 27 | 1.8842 | 0.1699 | |||||||||||||||||||||||||||||||||||||||||||||||||||||||||||||||||||||||||||||||||||||||||||||||
| Yes | 74 | 65 | |||||||||||||||||||||||||||||||||||||||||||||||||||||||||||||||||||||||||||||||||||||||||||||||||
| Inflammation extent | |||||||||||||||||||||||||||||||||||||||||||||||||||||||||||||||||||||||||||||||||||||||||||||||||||
| No | 74 | 44 | 1.1202 | 0.2899 | |||||||||||||||||||||||||||||||||||||||||||||||||||||||||||||||||||||||||||||||||||||||||||||||
| Yes | 65 | 53 | |||||||||||||||||||||||||||||||||||||||||||||||||||||||||||||||||||||||||||||||||||||||||||||||||
| Vascular invasion | |||||||||||||||||||||||||||||||||||||||||||||||||||||||||||||||||||||||||||||||||||||||||||||||||||
| No | 119 | 89 | 0.20509 | 0.6506 | |||||||||||||||||||||||||||||||||||||||||||||||||||||||||||||||||||||||||||||||||||||||||||||||
| Yes | 66 | 43 | |||||||||||||||||||||||||||||||||||||||||||||||||||||||||||||||||||||||||||||||||||||||||||||||||
| Family history | |||||||||||||||||||||||||||||||||||||||||||||||||||||||||||||||||||||||||||||||||||||||||||||||||||
| No | 125 | 84 | 0.11809 | 0.7311 | |||||||||||||||||||||||||||||||||||||||||||||||||||||||||||||||||||||||||||||||||||||||||||||||
| Yes | 64 | 48 | |||||||||||||||||||||||||||||||||||||||||||||||||||||||||||||||||||||||||||||||||||||||||||||||||
| Continuous variables | |||||||||||||||||||||||||||||||||||||||||||||||||||||||||||||||||||||||||||||||||||||||||||||||||||
| Age | 60(58, 62) | 59(57, 61) | 0.75 | 0.387 | |||||||||||||||||||||||||||||||||||||||||||||||||||||||||||||||||||||||||||||||||||||||||||||||
| BMI | 25(24, 26) | 26(25, 27) | 1.69 | 0.195 | |||||||||||||||||||||||||||||||||||||||||||||||||||||||||||||||||||||||||||||||||||||||||||||||
| AFP | 4980(1283, 8677) | 20152(−4890,45195) | 0.992 | 0.32 | |||||||||||||||||||||||||||||||||||||||||||||||||||||||||||||||||||||||||||||||||||||||||||||||
| BMI: body mass index; AFP: alpha fetoprotein. | |||||||||||||||||||||||||||||||||||||||||||||||||||||||||||||||||||||||||||||||||||||||||||||||||||
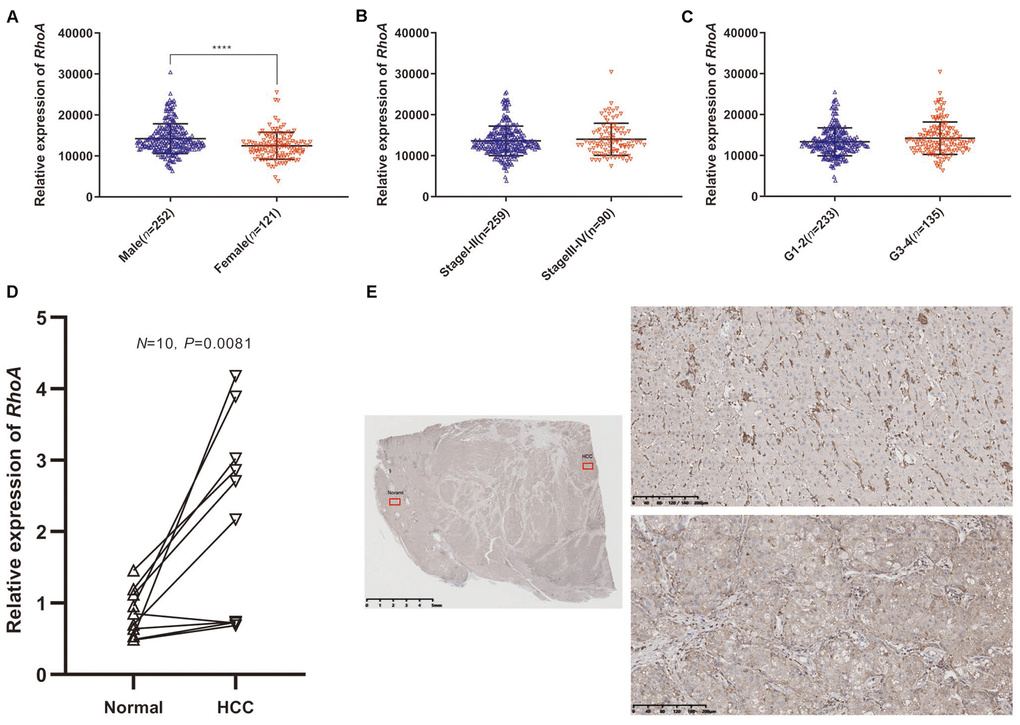
Figure 3. RhoA mRNA expression in different groups of patients and differential expression verification. Relative expression of RhoA in males and females (A), stage I-II and stage III-IV (B), and grade 1–2 and grade 3–4 (C) from TCGA data. The relative RhoA expression in ten pairs of normal tissues and HCC tissues from Peking Union Medical College Hospital identified through real-time quantitative polymerase chain reaction (D). The representative immunohistochemistry images of HCC tissue (lower right) and adjacent normal tissue (upper right): The red squares shown in the figure represents the enlarged area. (E).
mRNA and protein expression validation of RhoA
We further extracted RNA from 10 frozen HCC and paired adjacent liver tissues to quantify RhoA gene expression. The HCC tissues did have a significantly higher RhoA expression, which was consistent with the pattern identified in the HPA. (Figure 3D). Moreover, the IHC test of RhoA showed that the hepatic cells in the normal tissue were mainly stained negatively except for portions of the interstitial substance (Figure 3E, upper parts), while tumor cells in the HCC tissue from the same section were stained positively (Figure 3E, lower parts). In summary, although the mRNA and protein levels of RhoA were significantly higher in the HCC tissues than in the normal adjacent tissues, the RhoA protein level, rather than the mRNA level, seems to have a better distinction ability, which indicates its potential as a diagnostic biomarker.
Diagnostic model based on RhoA protein levels in liver cancer patients
To test our hypothesis, we performed additional IHC staining with 30 normal tissue samples and 134 HCC tissue samples from an HCC patient cohort from PUMCH to detect the protein expression profile of RhoA. Consistent with the previous results, the HCC samples had significantly higher RhoA protein levels (Figure 4A). Next, we divided patients into two groups, one with a high RhoA protein level (3+) and the other with a low level (0−2+). Similar to the outcome of the analysis of the prognostic function of RhoA gene expression, the HCC patients with longer OS times had lower RhoA protein levels (Figure 4B). Considering that the protein level of RhoA has better tissue specificity than gene expression between liver tumor tissues and adjacent normal tissues, the RhoA protein expression based on the results of the IHC analysis of normal tissues was mainly undetected (0) or low (1+), while that of the cancerous tissues was usually medium (2+) or high (3+). We proposed a diagnostic model based on this phenomenon (Figure 4C). After validation, the sensitivity and specificity of the model were 92.5% and 90.0%, respectively (Figure 4D). The area under the curve (AUC) of the receiver operating characteristic (ROC) curve was 0.913 (Figure 4E), which indicates the good performance of this model. To exclude false positive caused by antibody non-specificity, we performed immunohistochemical tests on some samples with another RhoA antibody (1:50, AF6352, Affinity biosciences, USA) and the results are in line with previous one (data not shown). Overall, the diagnostic model based on the RhoA IHC results expanded our current detection approaches for HCC.
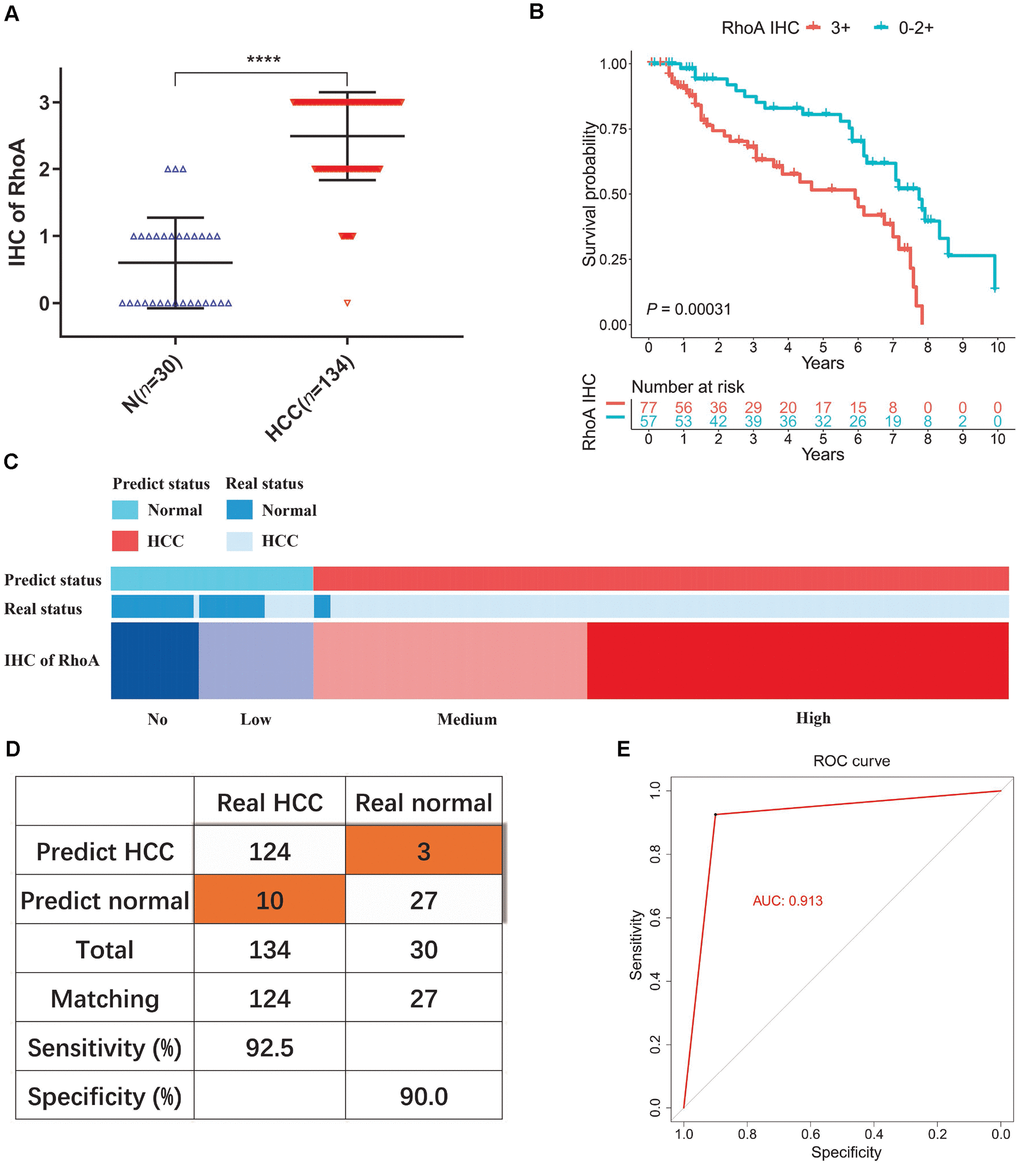
Figure 4. Diagnostic model of RhoA protein expression in liver cancer patients. The staining intensities of RhoA via immunohistochemistry chips from PUMCH patient samples (A). Kaplan-Meier curves of overall survival (B) of liver cancer patients with high RhoA protein expression levels (3+) and low RhoA protein expression levels (0–2+). Diagram (C), sensitivity and specificity validation (D) and receiver operating characteristic curve (E) of the diagnostic model according to RhoA immunohistochemistry level.
RhoA expression is modulated by genetic amplification and related KEGG pathways
Next, we explored the mechanisms of RhoA dysregulation using deep sequencing data from the University of California, Santa Cruz. After visualizing the somatic mutation, copy number variation, DNA methylation, and expression of RhoA, we found only four HCC samples with single nucleotide polymorphisms (SNPs), which demonstrated that point mutation did not play an essential role in RhoA expression (Figure 5A). Notably, the copy number variation and gene expression of RhoA shared a coexpression pattern, and the significant association was further validated via regression analysis (r = 0.563, P < 0.05, Figure 5B). However, the DNA methylation profile of the HCC tissues showed little variation (Figure 5A). To depict the exact relationships between DNA methylation and gene expression levels, we analyzed 405 samples with both methylation data and gene expression levels. As shown in Figure 5C, the increase in RhoA DNA methylation only slightly attenuated RhoA gene expression (r = −0.108, P < 0.05, Figure 5C). Furthermore, to detect the primary KEGG pathways in the two groups (RhoA high and low), we performed GSEA and found that samples with high levels of RhoA were enriched with genes mainly involved in the lysosome, pathogenic Escherichia coli infection, purine metabolism and pyrimidine metabolism pathways (Figure 5D, left part), while those with low levels of RhoA had predominant genes involved in the hedgehog signaling pathway, linoleic acid metabolism, olfactory transduction and taste transduction (Figure 5D, right part).
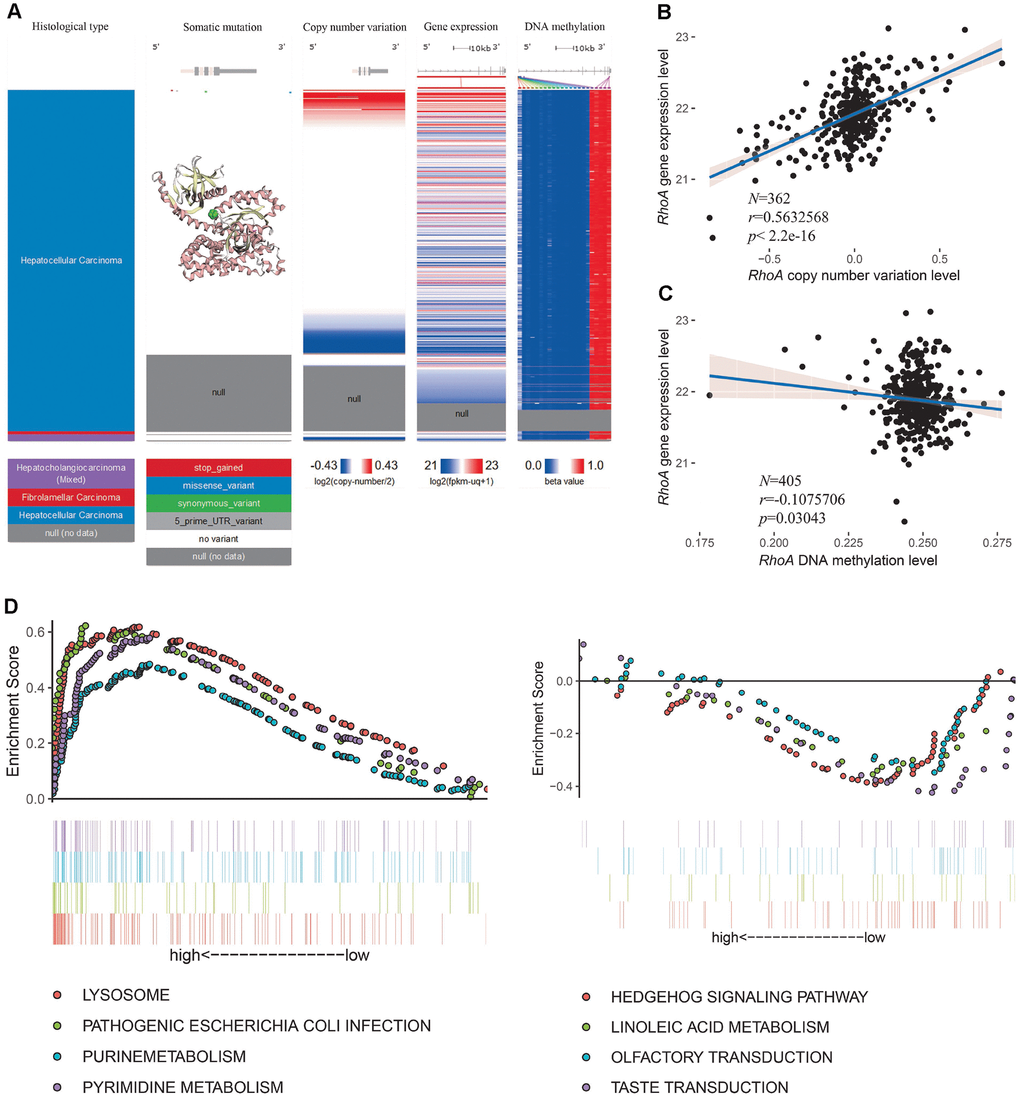
Figure 5. RhoA dysregulation and related KEGG analysis. Multiomic data of RhoA in liver cancer tissues are displayed in a heatmap (A). The correlation between RhoA gene expression level and copy number variation level (B) or DNA methylation level (C) were determined by regression analysis. The top 4 Kyoto Encyclopedia of Genes and Genomes pasthways identified via gene set enrichment analysis of tissues with high and low Rho expression levels (D).
Therefore, it seems that the copy number amplification level of RhoA, rather than the decrease in the DNA methylation level, plays a major role in the overexpression of RhoA in HCC tissues.
Discussion
As one of the leading causes of cancer deaths around the world, liver cancer continues to exhibit increasing incidence and mortality rates, especially in East Asia, Southeast Asia, Africa and southern Europe [8, 9]. Radical surgery can significantly improve the prognosis of some patients with early stage HCC; however, due to a lack of effective screening approaches and noticeable symptoms, most patients are in advanced stages the time of diagnosis and miss the optimal opportunity for treatment, which leads to dismal prognosis. Consequently, considerable research efforts have been devoted to identifying diagnostic and prognostic biomarkers of HCC with high specificity and sensitivity.
RhoA is one of the prototypical members of mammalian Rho GTPases, which include 23 intracellular signaling molecules, such as Ras-related C3 botulinum toxin substrate 1 (RAC1) and cell division cycle 42 (CDC42) [10–12]. The change in Rho GTPase proteins between the GTP-bound active form and the GDP-bound inactive form is regulated by three sets of molecules: guanine nucleotide exchange factors (GEFs), GTPase-activating proteins (GAPs), and guanine nucleotide dissociation inhibitors (GDIs) [10–12]. Activated Rho GTPases interact with downstream proteins and regulate cytoskeletal dynamics and a variety of biological processes, including cell division, survival, migration, and adhesion [10–12]. Considering the crucial roles of RhoA in the regulation of cell morphology, motility, and cell-cell and cell-matrix adhesion, we can easily deduce that RhoA is associated with carcinoma metastasis, which is one of the leading causes of death in patients with solid tumors [13, 14]. Recent studies have reported that the invasiveness and metastasis of rat and human hepatoma cells [15, 16], bladder cancer cells [17], colorectal cancer cells [18], and lung cancer cells [19] can be suppressed by inhibiting the Rho-ROCK (Rho-kinase) signaling pathway. However, there is some contradictory evidence showing that RhoA inactivation promoted the migration and metastasis of triple-negative breast cancer [20] and increased tumor growth and metastasis in colorectal cancer [21], liver cancers [22], and nasopharyngeal carcinoma [13]. Further mechanistic studies are needed to better elucidate the regulation of the RhoA signaling pathway in tumor metastasis, especially in HCC.
Taking the functions of RhoA in essential signaling pathways into account, we speculate that RhoA may be a potential functional biomarker in HCC. We initially examined both the mRNA and protein expression patterns of RhoA in normal human organs, common cancer types and cell lines using an HPA web-based tool. Intriguingly, although RhoA was significantly upregulated in HCC tissues compared with its expression in normal liver tissues, the basal expression of RhoA in normal liver tissue, HCC tissue, and the HCC cell line Hep G2 was actually very low among all the specimens. Notably, the RhoA protein was not detected in normal liver tissues but was significantly enriched in most HCC samples. It is well accepted that protein is a function executor according to the central dogma. The RhoA protein expression level in HCC ranked second, next to that in glioma, in all common tumor types, which indicated that the RhoA protein, rather than the gene, may promote liver tumorigenesis as an essential functional element. Recent studies have suggested that RhoA is one of the genes that is most frequently overexpressed in various cancer cells and is involved in cell division processes, and RhoA promotes HCC growth through the RhoA/F-actin/Hippo-YAP signaling axis [23]. In addition, the coordinated expression of Rac GTPase-activating protein 1 (RACGAP1) and epithelial cell transforming sequence 2 (ECT2) upregulated RhoA activity in HCC cells [23–25].
To evaluate the prognostic role of RhoA, we subsequently performed Kaplan-Meier analysis in the TCGA HCC cohort and found that high RhoA expression correlated well with poor prognosis. Two additional GEO cohorts also demonstrated this phenomenon. In addition, after univariate and multivariate analyses, RhoA expression levels, together with vascular invasion, were both independent prognostic factors in HCC, which was consistent with the results of a previous study [6]. Recent studies have also proven the prognostic value of RhoA in other cancer types, such as colorectal cancer, breast cancer, and glioma. Colorectal cancer patients with positive RhoA protein expression had higher vascular invasion rates, higher clinical stages, and lower 5-year survival rates [26]. Breast cancer samples with phosphorylated RhoA (P-RhoA) were associated with poorer prognosis [27]. Lin Yu demonstrated that SND1 (Staphylococcal nuclease domain-containing protein 1) and RhoA were independent predictors of poor prognosis in glioma patients [28]. Our results suggested only a relationship between gender and RhoA gene expression.
Furthermore, RhoA protein expression may be a diagnostic biomarker in HCC because its high liver cancer specificity was demonstrated by analyzing IHC sections from tumor resection margin areas of 9 HCC patients from PUMCH. Hence, we estimated the RhoA IHC staining intensities in a PUMCH HCC cohort of 130 liver tumor samples and 30 adjacent normal samples. The role of the RhoA protein was apparent from its expression and distribution. In addition to the prognostic ability of the gene, the RhoA protein level can clearly distinguish between normal and cancerous tissues with high sensitivity and specificity. This is the first time that the diagnostic role of RhoA was proposed and proven.
The essential position occupied by RhoA in the cancer cellular signaling pathway network has emphasized the importance of RhoA in cancer pathophysiology, and the intrinsic characteristics of RhoA make RhoA a great potential distinguished diagnostic and prognostic biomarker for liver cancer. As described before, instead of acting solely as a cancer indicator, RhoA also acts as a functional regulator. We next explored the dysregulation mechanism of gene expression via multiomics analysis. The results showed that the copy number amplification of RhoA mainly contributed to its increased gene expression, which may be a potential therapeutic target for HCC. The predominant KEGG pathways in the high RhoA level group and the low RhoA level group were further identified by using GSEA to reveal potential differential signaling pathways.
Overall, our study confirmed RhoA mRNA and protein levels as prognostic biomarkers in HCC through the analysis of multiple cohorts, and the use of RhoA as a prognostic biomarker has been reported in previous studies [5, 6, 23]. To the best of our knowledge, this is the first time that a diagnostic model was proposed based on RhoA IHC staining results rather than gene expression. Our estimations indicate that this model has very good performance (AUC=0.913) and high sensitivity and specificity (92.5% and 90.0%, respectively). However, due to limited HCC cohorts and RhoA IHC expression results, we could not perform external verification of this diagnostic model. In addition, future work will focus on utilizing clinical parameters along with biomarkers, which may improve the performance of the biomarkers [29]. In addition, further clarification of the exact RhoA expression regulatory mechanism is urgently needed.
Materials and Methods
Bioinformatics data mining and processing
The mRNA level and protein level of RhoA in both normal human tissues and cancerous tissues, as well as gene expression in cancer cell lines, were examined using data from the Human Protein Atlas (HPA) (http://www.proteinatlas.org/) [30, 31]. Representative immunohistochemistry images of RhoA protein expression profiles in HCC samples with different staining intensities were also downloaded from the HPA. The differential mRNA expression level of RhoA between HCC tissues and normal tissues from the TCGA database and the Genotype-Tissue Expression (GTEx) project were analyzed via the Gene Expression Profiling Interactive Analysis (GEPIA) web tool (http://gepia.cancer-pku.cn/). The mRNA transcriptome data and clinical parameters of liver hepatocellular carcinoma (LIHC) patients were obtained from the TCGA data portal (https://portal.gdc.cancer.gov/). Two other HCC validation datasets (GSE10186 and GSE54236) containing mRNA expression data and corresponding survival times were retrieved and downloaded from the GEO database (https://www.ncbi.nlm.nih.gov/geo/). Histological type, somatic mutation, copy number variation, gene expression, and DNA methylation of RhoA in liver cancer were visualized via a heatmap generated from the Xena browser web tool (https://xenabrowser.net/), and data used to analyze the factors affecting RhoA gene expression were downloaded from the Xena browser web tool. Analyzing the data downloaded from the TCGA and GEO databases did not require the approval of an ethics committee. Gene Set Enrichment Analysis (GSEA) was conducted to compare the distinct Kyoto Encyclopedia of Genes and Genomes (KEGG) pathways between the high RhoA level group and the low RhoA level group based on the TCGA HCC mRNA expression data.
Experimental validation with samples from Peking Union Medical College Hospital
From January 2004 to August 2016, thirty paired HCC and para-cancerous normal tissues and 104 HCC tissues from patients who underwent surgery and pathologically diagnosed as HCC at PUMCH were collected and made into four formalin-fixed paraffin-embedded (FFPE) tissue chips, the remaining tissues were frozen in liquid nitrogen and then stored at −80°C. Among these patient samples, the differential RhoA expression of ten frozen HCC tissues and paired adjacent normal tissues were validated by quantitative polymerase chain reaction (qPCR) as described previously [32]. The primer sequences were as follows: RhoA forward primer: 5′-AGCCTGTGGAAAGACATGCTT-3′; RhoA reverse primer: 5′-TCAAACACTGTGGGCACATAC-3′; β-actin forward primer: 5′-GCCGGGACCTGACTGACTAC-3′; β-actin reverse primer: 5′-CGGATGTCCACGTCACACTT-3′. Immunohistochemistry (IHC) sections of four FFPE tissue chips were stained with the RhoA antibody (EPR18134, RabMAb, UK) at a dilution of 1:100 to detect their protein profiles. In addition, nine IHC sections of the cancer margin with both normal and tumor components were used to elucidate the differential protein expression level of RhoA. The study was approved by the Medical Ethics Committee of PUMCH of the Chinese Academy of Medical Sciences (CAMS) & PUMC, and all patients signed informed consent forms.
Immunohistochemistry
Paraffin slices are cut into 3μm thick and placed on anti-unloading slides, baking 1 hour at 72°C. After 2–3 dewaxing with dimethylbenzene, slides are immersed into gradient alcohol (100%, 100%, 95% and 75%) successively. Rinse with PBS (1‰ Tween 20) for 5 times. Not less than 2 minutes each time. Preheat the repair solution in the pressure cooker to boiling then put the slides into the repair solution. After 2.5 minutes, wash slides to room temperature with cool water. Rinse with PBS for 5 times. Incubate with 3% H2O2 10–15 minutes at room temperature. Wash with distilled water first, then PBS for 5 times. Add primary antibody and overnight at 4 °C. Rinse with PBS for 5 times. Incubate with one-step detection system (PV-8000, ZSGB-BIO, China) for 20 minutes at 37°C. Rinse with PBS for 5 times. Color development with DAB (ZLI-9018, ZSGB-BIO, China) 6–8 minutes. Termination reaction with water. Re-satin with hematoxylin and wash with water. Differentiated by hydrochloric alcohol quickly. Return blue for 3–5 minutes via repair solution and rinse with running water for 3–5 minutes. Seal slides after dehydration with gradient alcohol.
Interpretation of immunohistochemical results was performed by two independent experienced pathologists based on the proportion of positive cells without considering dyeing intensity. Histochemical score from 0 to 3 as follows: 0, 1–5% positive cells; 1, 6–25% positive cells; 2, 26–75% positive cells; and 3, >76% positive cells. Samples with discordant scores from the two pathologists were discussed and re-scored.
Statistical analysis
Statistical analysis was performed using R software v.3.5.2. Continuous variables are reported as the means ± standard deviations (SDs). Differences between groups were compared by unpaired Student’s t-test and visualized by GraphPad Prism v.8.0 (GraphPad Inc.). The associations between RhoA expression and clinicopathological parameters were evaluated using the χ2 test. The OS curves of the above three HCC patient cohorts were generated based on the best cutoff value (X-tile algorithm) with the survival package in R. Univariate and multivariate Cox regression analyses were performed to identify independent prognostic variables based on RhoA level and other clinical characteristics, including age, gender, body mass index (BMI), stage, grade, fibrosis, AFP, extent of inflammation, vascular invasion, and family history. Unless noted otherwise, P < 0.05 was considered statistically significant. Linear regression analyses were conducted to assess the correlations between RhoA gene expression and copy number variation and between RhoA gene expression and DNA methylation. |R|>3 and P < 0.05 were considered relevant and statistically significant.
Conclusions
RhoA is commonly upregulated in HCC tissues, and both high mRNA expression and high protein expression levels are associated with poor prognosis. Notably, RhoA protein levels serve as a diagnostic biomarker for HCC.
Author Contributions
YB and FCX conceived the study and performed bioinformatics analyses. JZL, DXW, XY, JB, and FM downloaded and organized the clinical and gene expression data. YB and SH designed and executed experiments. FCX, FM, JYL, JZM and HCH performed the statistical analyses. YB and FCX wrote the manuscript. XW, YLM, XTS, and HTZ critically revised the article for essential intellectual content and provided administrative support. All authors read and approved the final version of the manuscript. All authors also reviewed and revised the manuscript. HTZ was the guarantor of this study.
Abbreviations
AFP: alpha-fetoprotein; BMI: body mass index; CAMS: Chinese Academy of Medical Sciences; CCLE: Cancer Cell Line Encyclopedia; CDC42: cell division cycle 42; CT: computer tomography; DKK1: dickkopf-1; ECT2: epithelial cell transforming sequence 2; FFPE: formalin-fixed paraffin-embedded; GAPs: GTPase-activating proteins; GDIs: guanine nucleotide dissociation inhibitors; GEFs: guanine nucleotide exchange factors; GEO: Gene Expression Omnibus; GEPIA: Gene Expression Profiling Interactive Analysis; GPC3: glypican-3; GSE: genomic spatial event; GSEA: Gene Set Enrichment Analysis; GTEx: Genotype-Tissue Expression; GTP: guanosine triphosphate; HCC: hepatocellular carcinoma; HPA: Human Protein Atlas; IHC: immunohistochemistry; KEGG: Kyoto Encyclopedia of Genes and Genomes; LIHC: liver hepatocellular carcinoma; MRI: magnetic resonance imaging; OS: overall survival; P-RhoA: phosphorylated RhoA; PUMCH: Peking Union Medical College Hospital; qPCR: quantitative polymerase chain reaction; RAC1: Ras-related C3 botulinum toxin substrate 1; RACGAP1: Rac GTPase-activating protein 1; RhoA: Ras homolog gene family, member A; SDs: standard deviations; SND1: Staphylococcal nuclease domain-containing protein 1; SNPs: single nucleotide polymorphisms; TCGA: The Cancer Genome Atlas; UI: ultrasound imaging.
Acknowledgments
We thanked Dongfeng Ge and Yuan Yuan, who are professional pathologists, for pathological consultation.
Conflicts of Interest
The authors declare that they have no Conflicts interests.
Funding
This work was supported by the International Science and Technology Cooperation Projects (2016YFE0107100), the Capital Special Research Project for Health Development (2014-2-4012), the Beijing Natural Science Foundation (L172055 and 7192158), the National Ten-thousand Talent Program, the Fundamental Research Funds for the Central Universities (3332018032), the CAMS Innovation Fund for Medical Science (CIFMS) (2017-I2M-4-003 and 2018-I2M-3-001), the Support Project of High-level Teachers in Beijing Municipal Universities in the Period of 13th Five–year Plan (IDHT20190510), the Ministry of Science and Technology of People’s Republic of China (2014CB910100), and the National Natural Science Foundation of China (81171899 and 81372230).
References
- 1. Torre LA, Siegel RL, Ward EM, Jemal A. Global Cancer Incidence and Mortality Rates and Trends—an Update. Cancer Epidemiol Biomarkers Prev. 2016; 25:16–27. https://doi.org/10.1158/1055-9965.EPI-15-0578 [PubMed]
- 2. Ferlay J, Soerjomataram I, Dikshit R, Eser S, Mathers C, Rebelo M, Parkin DM, Forman D, Bray F. Cancer incidence and mortality worldwide: sources, methods and major patterns in GLOBOCAN 2012. Int J Cancer. 2015; 136:E359–86. https://doi.org/10.1002/ijc.29210 [PubMed]
- 3. Li C, Li R, Zhang W. Progress in non-invasive detection of liver fibrosis. Cancer Biol Med. 2018; 15:124–36. https://doi.org/10.20892/j.issn.2095-3941.2018.0018 [PubMed]
- 4. Forner A, Llovet JM, Bruix J. Hepatocellular carcinoma. Lancet. 2012; 379:1245–55. https://doi.org/10.1016/S0140-6736(11)61347-0 [PubMed]
- 5. Wang D, Dou K, Xiang H, Song Z, Zhao Q, Chen Y, Li Y. Involvement of RhoA in progression of human hepatocellular carcinoma. J Gastroenterol Hepatol. 2007; 22:1916–20. https://doi.org/10.1111/j.1440-1746.2006.04534.x [PubMed]
- 6. Li XR, Ji F, Ouyang J, Wu W, Qian LY, Yang KY. Overexpression of RhoA is associated with poor prognosis in hepatocellular carcinoma. Eur J Surg Oncol. 2006; 32:1130–34. https://doi.org/10.1016/j.ejso.2006.05.012 [PubMed]
- 7. Fukui K, Tamura S, Wada A, Kamada Y, Sawai Y, Imanaka K, Kudara T, Shimomura I, Hayashi N. Expression and prognostic role of RhoA GTPases in hepatocellular carcinoma. J Cancer Res Clin Oncol. 2006; 132:627–33. https://doi.org/10.1007/s00432-006-0107-7 [PubMed]
- 8. Akinyemiju T, Abera S, Ahmed M, Alam N, Alemayohu MA, Allen C, Al-Raddadi R, Alvis-Guzman N, Amoako Y, Artaman A, Ayele TA, Barac A, Bensenor I, et al, and Global Burden of Disease Liver Cancer Collaboration. The Burden of Primary Liver Cancer and Underlying Etiologies From 1990 to 2015 at the Global, Regional, and National Level: Results From the Global Burden of Disease Study 2015. JAMA Oncol. 2017; 3:1683–91. https://doi.org/10.1001/jamaoncol.2017.3055 [PubMed]
- 9. Bertuccio P, Turati F, Carioli G, Rodriguez T, La Vecchia C, Malvezzi M, Negri E. Global trends and predictions in hepatocellular carcinoma mortality. J Hepatol. 2017; 67:302–09. https://doi.org/10.1016/j.jhep.2017.03.011 [PubMed]
- 10. Kataoka K, Ogawa S. Variegated RHOA mutations in human cancers. Exp Hematol. 2016; 44:1123–29. https://doi.org/10.1016/j.exphem.2016.09.002 [PubMed]
- 11. Heasman SJ, Ridley AJ. Mammalian Rho GTPases: new insights into their functions from in vivo studies. Nat Rev Mol Cell Biol. 2008; 9:690–701. https://doi.org/10.1038/nrm2476 [PubMed]
- 12. Tybulewicz VL, Henderson RB. Rho family GTPases and their regulators in lymphocytes. Nat Rev Immunol. 2009; 9:630–44. https://doi.org/10.1038/nri2606 [PubMed]
- 13. Yuan J, Chen L, Xiao J, Qi XK, Zhang J, Li X, Wang Z, Lian YF, Xiang T, Zhang Y, Chen MY, Bei JX, Zeng YX, Feng L. SHROOM2 inhibits tumor metastasis through RhoA-ROCK pathway-dependent and -independent mechanisms in nasopharyngeal carcinoma. Cell Death Dis. 2019; 10:58. https://doi.org/10.1038/s41419-019-1325-7 [PubMed]
- 14. Friberg S, Nyström A. Cancer Metastases: Early Dissemination and Late Recurrences. Cancer Growth Metastasis. 2015; 8:43–49. https://doi.org/10.4137/CGM.S31244 [PubMed]
- 15. Takamura M, Sakamoto M, Genda T, Ichida T, Asakura H, Hirohashi S. Inhibition of intrahepatic metastasis of human hepatocellular carcinoma by Rho-associated protein kinase inhibitor Y-27632. Hepatology. 2001; 33:577–81. https://doi.org/10.1053/jhep.2001.22652 [PubMed]
- 16. Itoh K, Yoshioka K, Akedo H, Uehata M, Ishizaki T, Narumiya S. An essential part for Rho-associated kinase in the transcellular invasion of tumor cells. Nat Med. 1999; 5:221–25. https://doi.org/10.1038/5587 [PubMed]
- 17. Jiang L, Wen J, Luo W. Rho-associated kinase inhibitor, Y-27632, inhibits the invasion and proliferation of T24 and 5367 bladder cancer cells. Mol Med Rep. 2015; 12:7526–30. https://doi.org/10.3892/mmr.2015.4404 [PubMed]
- 18. Voorneveld PW, Kodach LL, Jacobs RJ, Liv N, Zonnevylle AC, Hoogenboom JP, Biemond I, Verspaget HW, Hommes DW, de Rooij K, van Noesel CJ, Morreau H, van Wezel T, et al. Loss of SMAD4 alters BMP signaling to promote colorectal cancer cell metastasis via activation of Rho and ROCK. Gastroenterology. 2014; 147:196–208.e13. https://doi.org/10.1053/j.gastro.2014.03.052 [PubMed]
- 19. Li B, Zhao WD, Tan ZM, Fang WG, Zhu L, Chen YH. Involvement of Rho/ROCK signalling in small cell lung cancer migration through human brain microvascular endothelial cells. FEBS Lett. 2006; 580:4252–60. https://doi.org/10.1016/j.febslet.2006.06.056 [PubMed]
- 20. Humphries B, Wang Z, Li Y, Jhan JR, Jiang Y, Yang C. ARHGAP18 Downregulation by miR-200b Suppresses Metastasis of Triple-Negative Breast Cancer by Enhancing Activation of RhoA. Cancer Res. 2017; 77:4051–64. https://doi.org/10.1158/0008-5472.CAN-16-3141 [PubMed]
- 21. Rodrigues P, Macaya I, Bazzocco S, Mazzolini R, Andretta E, Dopeso H, Mateo-Lozano S, Bilić J, Cartón-García F, Nieto R, Suárez-López L, Afonso E, Landolfi S, et al. RHOA inactivation enhances Wnt signalling and promotes colorectal cancer. Nat Commun. 2014; 5:5458. https://doi.org/10.1038/ncomms6458 [PubMed]
- 22. Chew TW, Liu XJ, Liu L, Spitsbergen JM, Gong Z, Low BC. Crosstalk of Ras and Rho: activation of RhoA abates Kras-induced liver tumorigenesis in transgenic zebrafish models. Oncogene. 2014; 33:2717–27. https://doi.org/10.1038/onc.2013.240 [PubMed]
- 23. Yang XM, Cao XY, He P, Li J, Feng MX, Zhang YL, Zhang XL, Wang YH, Yang Q, Zhu L, Nie HZ, Jiang SH, Tian GA, et al. Overexpression of Rac GTPase Activating Protein 1 Contributes to Proliferation of Cancer Cells by Reducing Hippo Signaling to Promote Cytokinesis. Gastroenterology. 2018; 155:1233–1249.e22. https://doi.org/10.1053/j.gastro.2018.07.010 [PubMed]
- 24. Chen J, Xia H, Zhang X, Karthik S, Pratap SV, Ooi LL, Hong W, Hui KM. ECT2 regulates the Rho/ERK signalling axis to promote early recurrence in human hepatocellular carcinoma. J Hepatol. 2015; 62:1287–95. https://doi.org/10.1016/j.jhep.2015.01.014 [PubMed]
- 25. Breznau EB, Semack AC, Higashi T, Miller AL. MgcRacGAP restricts active RhoA at the cytokinetic furrow and both RhoA and Rac1 at cell-cell junctions in epithelial cells. Mol Biol Cell. 2015; 26:2439–55. https://doi.org/10.1091/mbc.E14-11-1553 [PubMed]
- 26. Jeong D, Park S, Kim H, Kim CJ, Ahn TS, Bae SB, Kim HJ, Kim TH, Im J, Lee MS, Kwon HY, Baek MJ. RhoA is associated with invasion and poor prognosis in colorectal cancer. Int J Oncol. 2016; 48:714–22. https://doi.org/10.3892/ijo.2015.3281 [PubMed]
- 27. Ma L, Liu YP, Zhang XH, Geng CZ, Li ZH. Relationship of RhoA signaling activity with ezrin expression and its significance in the prognosis for breast cancer patients. Chin Med J (Engl). 2013; 126:242–47. [PubMed]
- 28. Yu L, Xu J, Liu J, Zhang H, Sun C, Wang Q, Shi C, Zhou X, Hua D, Luo W, Bian X, Yu S. The novel chromatin architectural regulator SND1 promotes glioma proliferation and invasion and predicts the prognosis of patients. Neuro-oncol. 2019; 21:742–54. https://doi.org/10.1093/neuonc/noz038 [PubMed]
- 29. Wang M, Block TM, Marrero J, Di Bisceglie AM, Devarajan K, Mehta A. Improved biomarker performance for the detection of hepatocellular carcinoma by inclusion of clinical parameters. Proceedings (IEEE Int Conf Bioinformatics Biomed). 2012. [Epub ahead of print]. https://doi.org/10.1109/BIBM.2012.6392612 [PubMed]
- 30. Uhlen M, Oksvold P, Fagerberg L, Lundberg E, Jonasson K, Forsberg M, Zwahlen M, Kampf C, Wester K, Hober S, Wernerus H, Björling L, Ponten F. Towards a knowledge-based Human Protein Atlas. Nat Biotechnol. 2010; 28:1248–50. https://doi.org/10.1038/nbt1210-1248 [PubMed]
- 31. Uhlén M, Fagerberg L, Hallström BM, Lindskog C, Oksvold P, Mardinoglu A, Sivertsson Å, Kampf C, Sjöstedt E, Asplund A, Olsson I, Edlund K, Lundberg E, et al. Proteomics. Tissue-based map of the human proteome. Science. 2015; 347:1260419. https://doi.org/10.1126/science.1260419 [PubMed]
- 32. Liu C, Huang S, Wang X, Wen M, Zheng J, Wang W, Fu Y, Tian S, Li L, Li Z, Wang X. The Otubain YOD1 Suppresses Aggregation and Activation of the Signaling Adaptor MAVS through Lys63-Linked Deubiquitination. J Immunol. 2019; 202:2957–70. https://doi.org/10.4049/jimmunol.1800656 [PubMed]