


Introduction
Bladder cancer (BLCA) is the ninth most common malignant cancer with high incidence and recurrence rates [1, 2]. The risk evaluation of prognosis and recurrence has a critical impact on clinical decision and patient consultation [3]. The most significant factors involved in this evaluation include general condition of patients, clinicopathological characteristics, clinical treatment and progression of disease [1, 4, 5]. Additionally, tumor node metastasis (TNM) staging system, is currently applied in clinical work as the most common prediction tool [4, 6]. Nevertheless, this single clinical prediction model is considered less accurate at prediction than models merging several clinical characteristics [7]. Moreover, the current clinical prediction model cannot facilely incorporate novel factors, such as molecular biomarkers and complex external environmental factors [5].
Over the years, scientists have proposed numerous potential molecular signatures as predictors of the risk of cancer progression, with the most important of them being the DNA methylation-based models [8–10], mRNA [11, 12], microRNA(miRNA) [13] and long non-coding RNA (lncRNA)-based models [14, 15]. Increasing evidence has indicated the critical role of lncRNAs in BLCA prognosis and recurrence, being involved in cancer initiation, progression and metastasis [16]. However, the prognostic value of lncRNAs in BLCA has not been adequately explored yet.
In this study, in an effort to assess the potential utility of lncRNAs in prognosis and recurrence of BLCA, we constructed a 14-lncRNA-based classifier for overall survival (OS) and a 12-lncRNA-based classifier for relapse-free survival (RFS) by using the least absolute shrinkage and selection operation (LASSO) Cox regression. Both of the lncRNA-based classifiers could optimize the predictivity of the current TNM staging system. Our results demonstrate that these lncRNA-based classifiers could be used as reliable prognostic predictors of BLCA survival and recurrence.
Results
Data source and processing
The lncRNA expression profiles in BLCA tissues (n=414) along with the adjacent non-tumor tissues (n=19) were obtained from the TCGA database. As shown in Figure 1, a total of 1643 DElncRNAs (Figure 2A) with |logFC| >1 and padj < 0.05 were identified using edgeR. Additionally, lncRNAs with p < 0.05 were chosen by applying a univariate Cox regression in the entire data. Following this, 463 lncRNAs (OS, Figure 2B) and 201 lncRNAs (RFS, Figure 2C) were retained for the next step of the analysis. For OS, these samples (n=406) were randomly split into training (n=271) and validation sets (n=135) at 2:1 ratio. Similarly, for RFS, the samples (n=337) were randomly split into training (n=225) and validation sets (n=112) at a 2:1 ratio. The LASSO Cox selection method was applied to construct the prognosis-predicting models in the training cohort at a 20-fold cross-validation (OS: Figure 2D, 2E; RFS: Figure 2F, 2G).
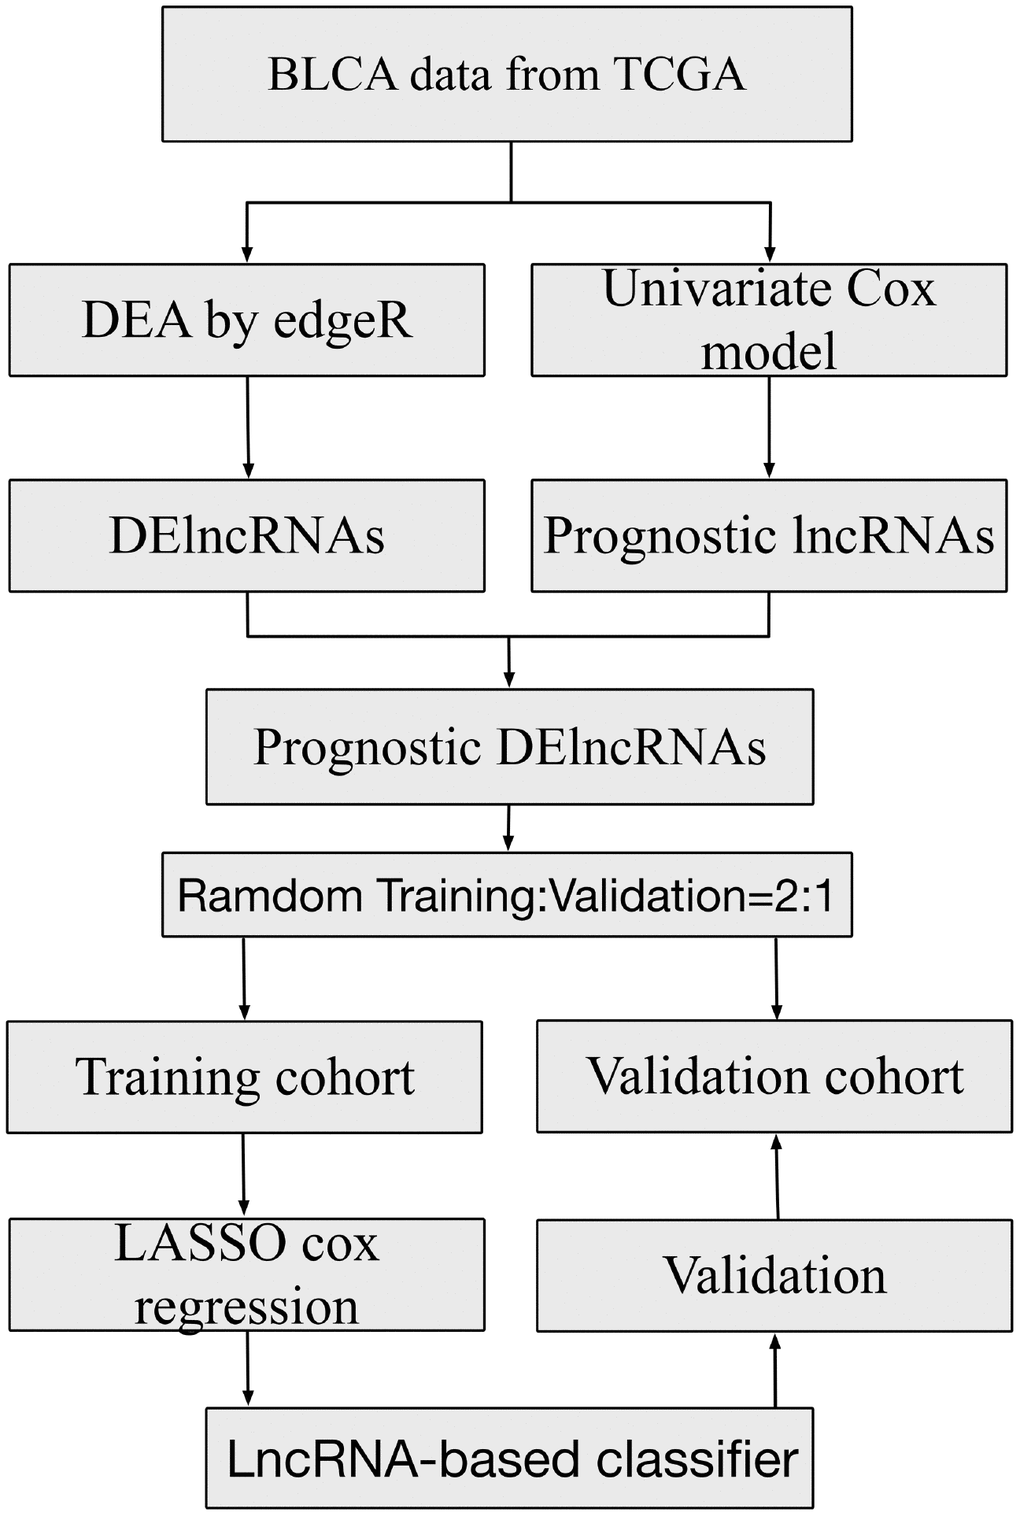
Figure 1. Study flowchart showing steps involved in construction of lncRNA-based prognostic signatures.
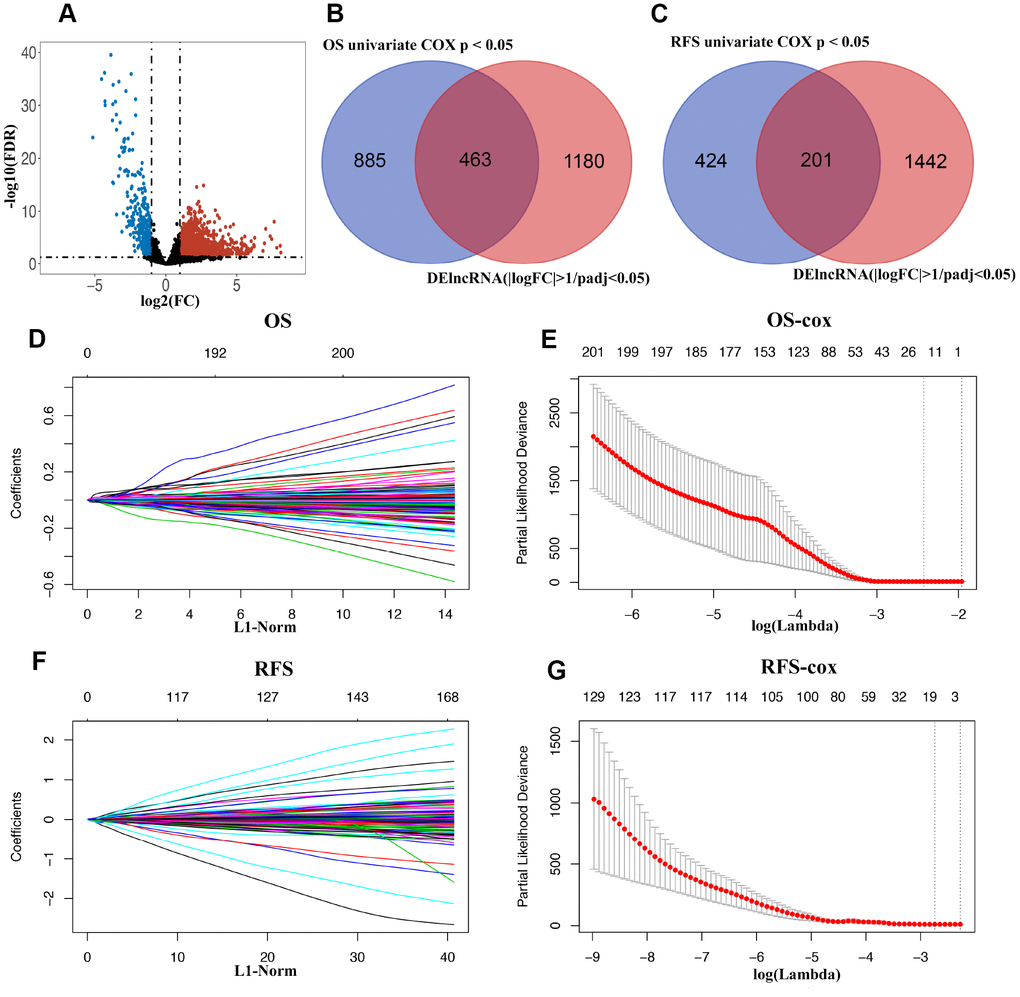
Figure 2. (A) Volcano plot of differentially expressed lncRNAs in TCGA-BLCA cohort. (B and C) Venn diagram of prognostic DElncRNAs in prognostic lncRNAs (OS/RFS univariate cox p < 0.05) and DElncRNAs(|logFC| >1 and padj < 0.05). (D) 20-time cross-validation for tuning parameter selection in the LASSO model for OS. (E) LASSO coefficient profiles of 463 prognostic DElncRNAs for OS. (F) 20-time cross-validation for tuning parameter selection in the LASSO model for RFS. (G) LASSO coefficient profiles of 201 prognostic DElncRNAs for RFS.
Construction of lncRNAs classifiers for OS and RFS
In the training cohort, a 14-lncRNA-based classifier for OS and a 12-lncRNA-based classifier for RFS were constructed using the LASSO Cox regression mode at 20-fold cross-validation. Detailed information of these lncRNAs is shown in Table 1. According to the prediction value, patients were divided into high- and low-risk groups based on the cut-off of the median risk score. The Kaplan–Meier log-rank test showed significant differences in OS and RFS between low- and high-risk groups in the training cohorts (Figure 3A, 3B), the validation cohorts (Figure 3C, 3D) and in the whole cohorts (Figure 3E, 3F).
Table 1. The detailed information of lncRNAs for constructing the prognostic signature.
| 14-lncRNA-based classifier for OS | |||||
| Gene name | ENSG_ID | Chromosome | Gene start (bp) | Gene end (bp) | β |
| AL662844.4 | ENSG00000272501.1 | 6p21.33 | 31195200 | 31198037 | 0.000859567 |
| MAFG-AS1 | ENSG00000265688 | 17q25.3 | 81927829 | 81930753 | 0.00024963 |
| RNF144A-AS1 | ENSG00000228203 | 2p25.1 | 6918682 | 6912276 | 0.00135716 |
| AC093788.1 | ENSG00000273449 | 4q32.2 | 163529771 | 163530697 | 0.001168141 |
| AC024060.1 | ENSG00000271870 | 3p26.2 | 3152942 | 3153435 | 0.000445531 |
| LINC01138 | ENSG00000274020 | 1q21.2 | 148459920 | 148432959 | 0.000350856 |
| Z84484.1 | ENSG00000224666 | 6p21.31 | 36386831 | 36393462 | 0.002095112 |
| MANCR | ENSG00000231298 | 10p15.1 | 4650185 | 4678154 | 0.000322206 |
| AL590428.1 | ENSG00000231652 | 6q13 | 73693903 | 73696131 | 0.004351042 |
| CERS3-AS1 | ENSG00000259430 | 15q26.3 | 100372939 | 100437914 | 0.003812687 |
| AL590999.1 | ENSG00000235033 | 6p21.2 | 39881804 | 39900071 | 0.000167192 |
| Z98200.1 | ENSG00000271734 | 6q21 | 108030249 | 108030718 | 0.003081411 |
| LINC01169 | ENSG00000259471 | 15q22.31 | 66582190 | 66685798 | 0.002831088 |
| AL049775.1 | ENSG00000205562 | 14q31.3 | 85530313 | 85522055 | 0.002947469 |
| 12-lncRNA-based classifier for RFS | |||||
| Gene name | ENSG_ID | Chromosome | Gene start (bp) | Gene end (bp) | β |
| NALCN-AS1 | ENSG00000233009 | 13q32.3 | 100708325 | 101059286 | 0.003081179 |
| AL353593.2 | ENSG00000269934 | 1q42.13 | 228274584 | 228276066 | 0.007001554 |
| AC116914.2 | ENSG00000262692 | 17p13.2 | 3721628 | 3722488 | 0.000160626 |
| AC092910.3 | ENSG00000242622 | 3q13.33 | 120094895 | 120136783 | 0.00432904 |
| FLJ22447 | ENSG00000232774 | 14q23.1 | 61570540 | 61658696 | 0.000201789 |
| SH3RF3-AS1 | ENSG00000259863 | 2q13 | 109127327 | 109128930 | 0.006699057 |
| AL121658.1 | ENSG00000272716 | 2p22.3 | 32165046 | 32165757 | 0.005552396 |
| AL590428.1 | ENSG00000231652 | 6q13 | 73693903 | 73696131 | 0.003681168 |
| AC080013.3 | ENSG00000271778 | 3q25.32 | 158782547 | 158783124 | 0.001601851 |
| LSAMP-AS1 | ENSG00000240922 | 3q13.31 | 116360024 | 116370090 | 0.011192555 |
| SLC26A4-AS1 | ENSG00000233705 | 7q22.3 | 107653968 | 107662151 | 0.002233053 |
| AC023051.1 | ENSG00000234428 | 12p11.23 | 26623369 | 26649479 | 0.011428433 |
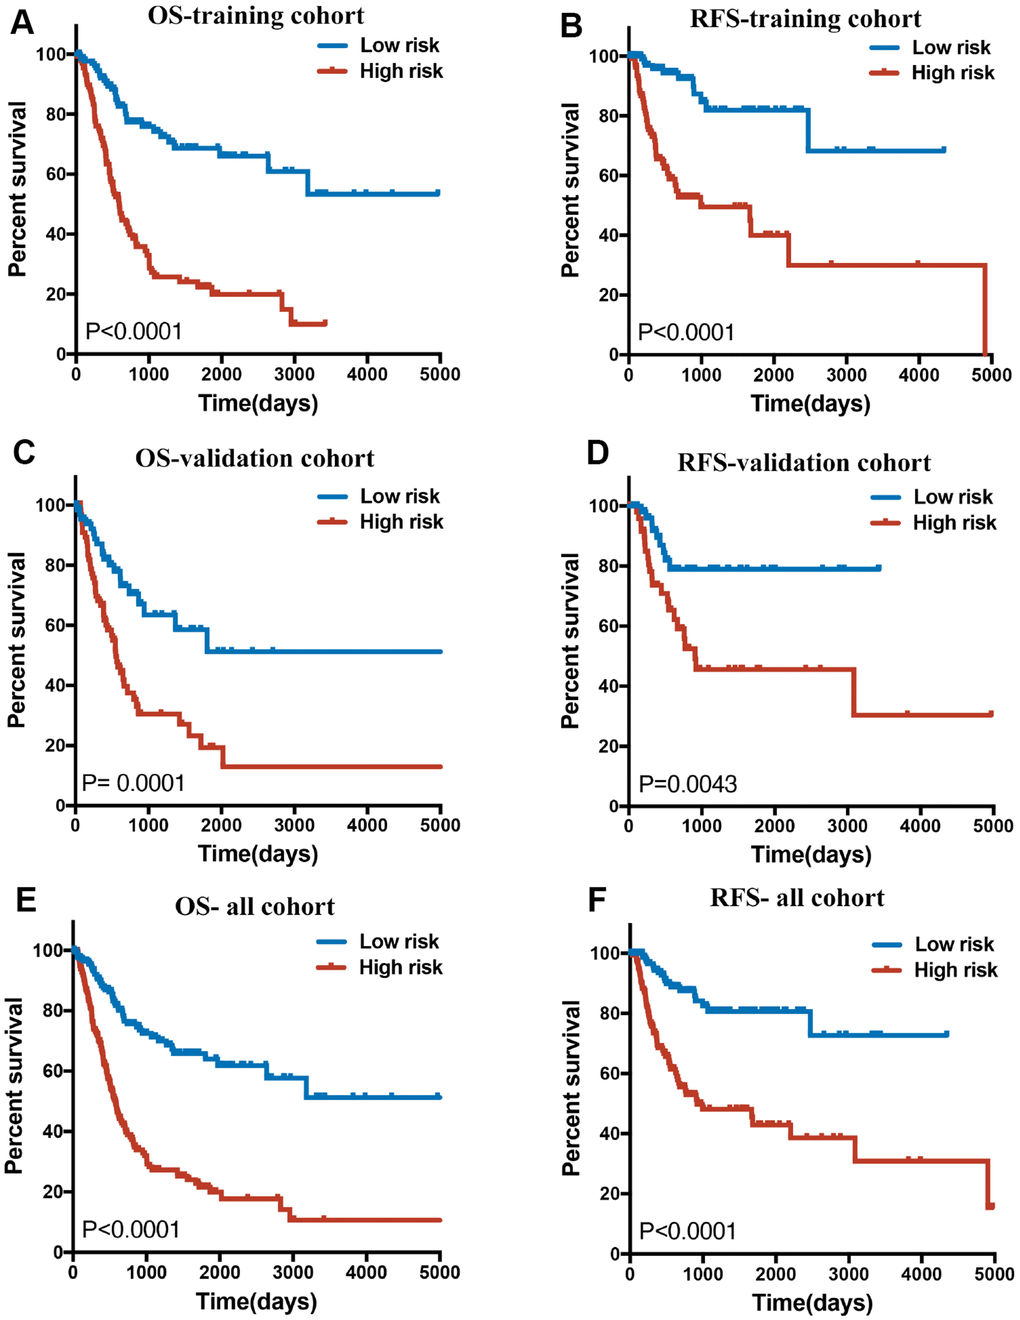
Figure 3. (A, C and E) Overall survival curves of BLCA patients in training, validation and all cohorts with a low or high risk of death, according to 14-lncRNA-based classifier risk score level. (B, D and F): Relapse-free survival curves of BLCA patients in training, validation and all cohorts with a low or high risk of death, according to 12-lncRNA-based classifier risk score level.
Correlation between lncRNAs classifiers and clinicopathologic characteristics
There were no significant difference and deviation between the training cohort and the validation cohort, because these samples were randomly split into training and validation sets at a 2:1 ratio in Tables 2–5. As shown in Table 2, for OS, the clinical characteristics (subtype, pT, pN and grade) showed significant differences between the two groups in whole cohort. However, for RFS, many clinical characteristics, except pT, did not vary significantly between the two groups in whole cohort (Table 3). Though the lncRNA-based risk scores of OS or RFS were independent of several clinical characteristics, positive associations were detected between them (Figure 4). Patients with high pT, pN or grade were inclined to have a high-risk score.
Table 2. Correlations between risk score of the 14-marker-based classifier with OS and clinicopathological characteristics in training cohort, validation cohort and whole cohort.
| Parameters | High risk | Low risk | Pearson x2 | P |
| Training cohort | ||||
| Age | 0.06006 | 0.8064 | ||
| >60 | 102 | 101 | ||
| ≤60 | 33 | 35 | ||
| Gender | 1.336519 | 0.247649 | ||
| male | 97 | 106 | ||
| female | 38 | 30 | ||
| –Subtype | 6.471522 | 0.010962 | ||
| Papillary | 37 | 58 | ||
| Non-Papillary | 96 | 78 | ||
| pT | 4.199471 | 0.040437 | ||
| T3-4 | 93 | 75 | ||
| T0-2 | 35 | 49 | ||
| pN | 0.411615 | 0.521151 | ||
| N1-3 | 39 | 35 | ||
| N0 | 82 | 88 | ||
| pM | 1.633899 | 0.502242 | ||
| M1 | 0 | 2 | ||
| M0 | 62 | 75 | ||
| Grade | 6.48751 | 0.010864 | ||
| high | 131 | 3 | ||
| low | 123 | 13 | ||
| Validation cohort | ||||
| Age | 0.141667 | 0.70663 | ||
| >60 | 49 | 47 | ||
| ≤60 | 19 | 21 | ||
| Gender | 1.314715 | 0.251543 | ||
| male | 46 | 52 | ||
| female | 22 | 16 | ||
| Subtype | 8.421529 | 0.003708 | ||
| Papillary | 10 | 25 | ||
| Non-Papillary | 56 | 42 | ||
| pT | 3.986205 | 0.045874 | ||
| T3-4 | 48 | 35 | ||
| T0-2 | 15 | 24 | ||
| pN | 9.125692 | 0.00252 | ||
| N1-3 | 36 | 19 | ||
| N0 | 25 | 41 | ||
| pM | 2.92108 | 0.087429 | ||
| M1 | 6 | 3 | ||
| M0 | 22 | 38 | ||
| Grade | 5.193798 | 0.022668 | ||
| high | 67 | 62 | ||
| low | 0 | 5 | ||
| Whole cohort | ||||
| Age | 0.317257 | 0.573261 | ||
| >60 | 152 | 147 | ||
| ≤60 | 51 | 56 | ||
| Gender | 2.50239 | 0.113674 | ||
| male | 143 | 157 | ||
| female | 60 | 46 | ||
| Subtype | 15.606417 | 0.000078 | ||
| Papillary | 46 | 84 | ||
| Non-Papillary | 153 | 118 | ||
| pT | 7.172964 | 0.007401 | ||
| T3-4 | 142 | 109 | ||
| T0-2 | 51 | 71 | ||
| pN | 5.465341 | 0.019397 | ||
| N1-3 | 75 | 53 | ||
| N0 | 108 | 128 | ||
| pM | 0.579021 | 0.537858 | ||
| M1 | 6 | 5 | ||
| M0 | 84 | 112 | ||
| Grade | 11.224962 | 0.000807 | ||
| high | 198 | 184 | ||
| low | 3 | 18 | ||
Table 3. Correlations between risk score of the 12-marker-based classifier with RFS and clinicopathological characteristics in training cohort, validation cohort and whole cohort.
| Parameters | High risk | Low risk | Pearson x2 | P |
| Training cohort | ||||
| Age | 0.421 | 0.516 | ||
| >60 | 81 | 86 | ||
| ≤60 | 31 | 27 | ||
| Gender | 1.052 | 0.305 | ||
| male | 86 | 93 | ||
| female | 26 | 20 | ||
| Subtype | 0.880 | 0.348 | ||
| Papillary | 34 | 42 | ||
| Non-Papillary | 75 | 71 | ||
| pT | 3.823 | 0.0506 | ||
| T3-4 | 72 | 64 | ||
| T0-2 | 27 | 43 | ||
| pN | 2.379 | 0.123 | ||
| N1-3 | 36 | 25 | ||
| N0 | 69 | 77 | ||
| pM | 0.4292 | 0.685 | ||
| M1 | 4 | 2 | ||
| M0 | 62 | 55 | ||
| Grade | 0.000255 | 0.987 | ||
| high | 105 | 106 | ||
| low | 6 | 6 | ||
| Validation cohort | ||||
| Age | 0.175 | 0.676 | ||
| >60 | 39 | 41 | ||
| ≤60 | 17 | 15 | ||
| Gender | 0.676 | 0.411 | ||
| male | 37 | 41 | ||
| female | 19 | 15 | ||
| Subtype | 0.00433 | 0.948 | ||
| Papillary | 18 | 18 | ||
| Non-Papillary | 38 | 37 | ||
| pT | 7.104 | 0.00769 | ||
| T3-4 | 37 | 24 | ||
| T0-2 | 13 | 26 | ||
| pN | 0.0504 | 0.822 | ||
| N1-3 | 14 | 15 | ||
| N0 | 32 | 31 | ||
| pM | 0.390 | 0.611 | ||
| M1 | 2 | 1 | ||
| M0 | 26 | 28 | ||
| Grade | 0.578 | 0.489 | ||
| high | 53 | 50 | ||
| low | 3 | 5 | ||
| Whole cohort | ||||
| Age | 0.595 | 0.440 | ||
| >60 | 120 | 127 | ||
| ≤60 | 48 | 42 | ||
| Gender | 0.638 | 0.425 | ||
| male | 125 | 132 | ||
| female | 43 | 37 | ||
| Subtype | 0.658 | 0.417 | ||
| Papillary | 52 | 60 | ||
| Non-Papillary | 113 | 108 | ||
| pT | 8.317 | 0.00393 | ||
| T3-4 | 108 | 89 | ||
| T0-2 | 41 | 68 | ||
| pN | 0.801 | 0.371 | ||
| N1-3 | 49 | 41 | ||
| N0 | 102 | 107 | ||
| pM | 0.0421 | 0.837 | ||
| M1 | 5 | 4 | ||
| M0 | 89 | 82 | ||
| Grade | 0.213 | 0.645 | ||
| high | 158 | 156 | ||
| low | 9 | 11 | ||
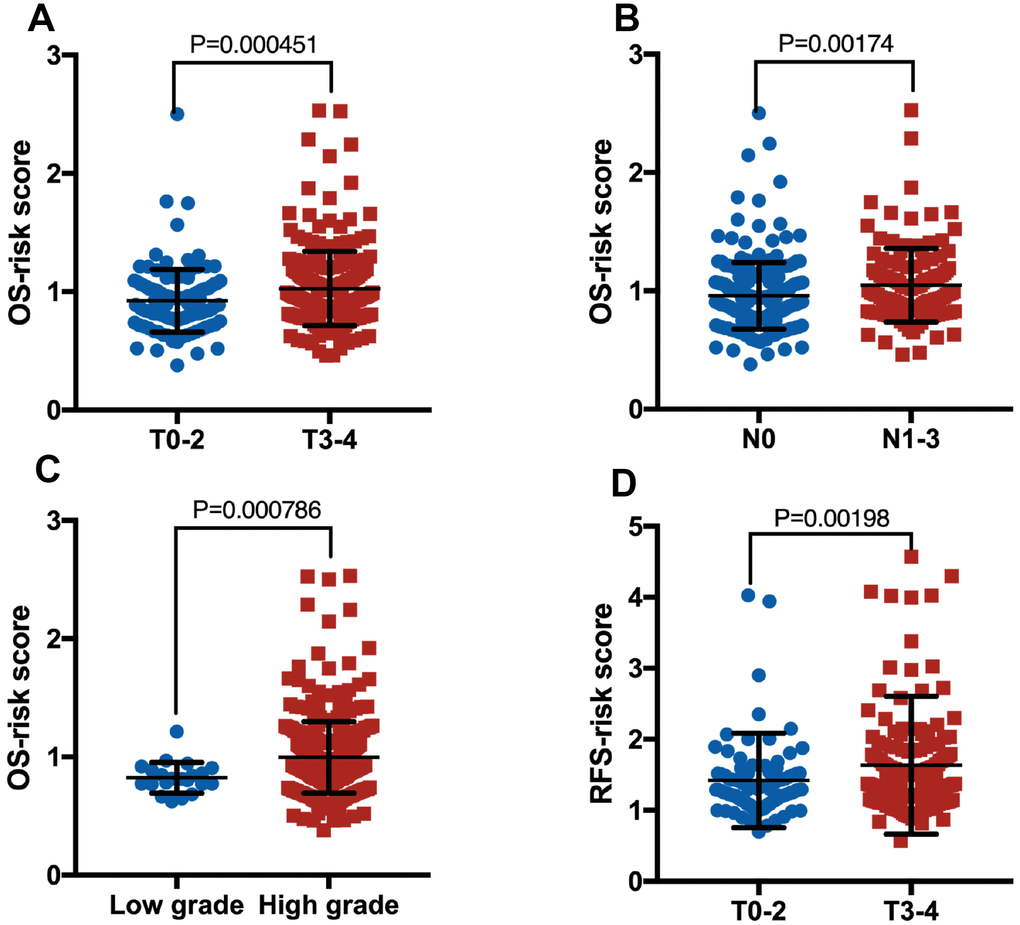
Figure 4. Boxplot of risk score in patients with pT (A, OS), pN (B, OS), grade (C, OS) and pT (D, RFS).
Prognostic value of lncRNAs classifiers for assessing clinical outcome
In the time-dependent ROC curve analysis, the AUCs for OS (Figure 5A) in the first, third, and fifth year were 0.734, 0.78, and 0.78 respectively, while the prediction capability of the 14-lncRNA classifier was superior to the previously published lncRNA classifier [17]. As for RFS (Figure 5B), the AUCs in the first, third, and fifth year were 0.755, 0.715, and 0.740 respectively, whilst the 12-lncRNA-based classifier was mainly built to be a powerful prognostic predictor of BLCA recurrence. As shown in Table 4, the 14-marker-based classifier, age, pT, pN and pM were significantly associated with OS in the univariate Cox regression analyses. After the multivariate Cox regression analyses of the above-mentioned factors, only the 14-marker-based classifier model was retained to be a dependable and independent prognostic factor for OS (p < 0.001) in whole cohort. In univariate Cox regression analyses, the 12-marker- based classifier, subtype, pT, pN and pM were significantly associated with RFS in Table 5. Finally, the multivariate Cox regression analyses revealed that only the 12-marker-based classifier model could be a novel and independent prognostic factor for RFS (p= 0.001) in whole cohort.
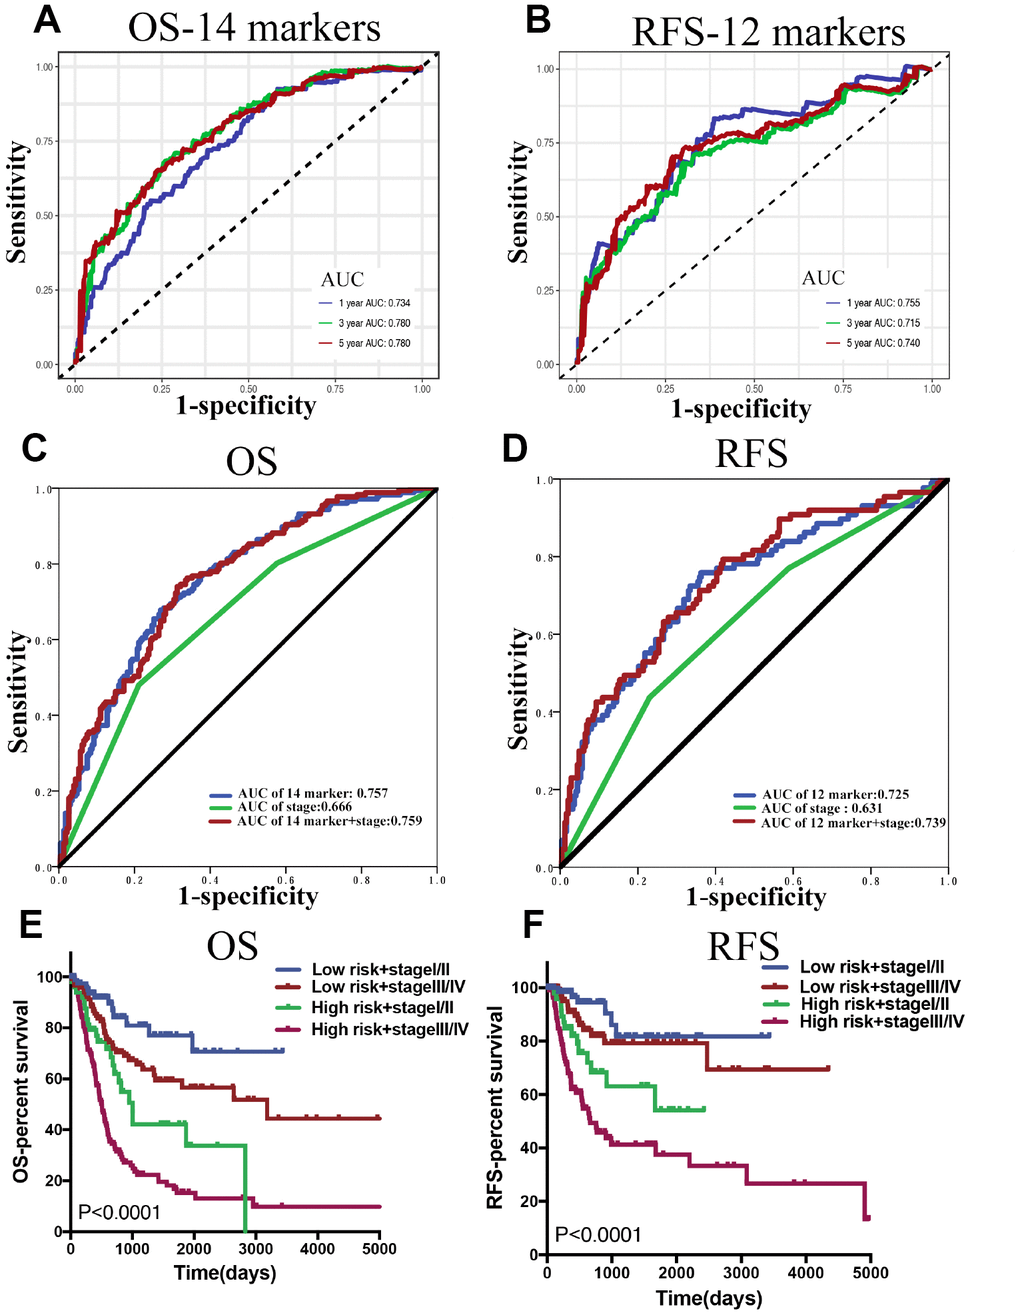
Figure 5. (A and B) Time dependent ROC curves at 1, 3 and 5 years, separately for OS and RFS. (C and D) The ROC for the lncRNA-score, stage, and lncRNA-score combined with stage for OS and RFS in whole BLCA cohorts. (E and F) Survival curves of BLCA patients with combinations of lncRNA-score risk and stage in the whole cohorts for OS and RFS.
Table 4. Univariate and multivariate Cox regression analysis of the 14-marker-based classifier with OS in training cohort, validation cohort and whole cohort.
| Parameters | Univariate COX | Multivariate COX | ||
| HR (95% CI) | P | HR (95% CI) | P | |
| Training cohort | ||||
| Age (>60 vs ≤60) | 1.506(0.937,2.421) | 0.090459 | 0.910(0.399,2.076) | 0.823185 |
| Gender(male vs female) | 0.934(0.620,1.406) | 0.742189 | ||
| Subtype (Papillary vs Non-Papillary) | 0.780(0.512,1.189) | 0.248073 | 1.043(0.508,2.142) | 0.909174 |
| pT (T3-4 vs T0-2) | 1.654(1.066,2.564) | 0.024634 | 1.269(0.513,3.138) | 0.605957 |
| pN (N1-3 vs N0) | 2.153(1.451,3.196) | 1.41E-04 | 1.599(0.834,3.066) | 0.157505 |
| pM (M1 vs M0) | 1.969(0.270,14.378) | 0.504059 | ||
| Grade(high vs low) | 1.998(0.491,8.129) | 0.333785 | ||
| 14-marker-based classifier (high risk vs low risk) | 3.994(2.629,6.068) | 8.66E-11 | 5.215(2.502,10.869) | 0.00001 |
| Validation cohort | ||||
| Age (>60 vs ≤60) | 3.135(1.595,6.165) | 0.000923 | 2.766(1.286,5.948) | 0.009202 |
| Gender(male vs female) | 0.755(0.442,1.291) | 0.30446 | ||
| Subtype (Papillary vs Non-Papillary) | 0.463(0.236,0.911) | 0.025825 | 0.706(0.325,1.533) | 0.378535 |
| pT (T3-4 vs T0-2) | 4.020(1.904,8.487) | 0.000264 | 3.014(1.222,7.433) | 0.016621 |
| pN (N1-3 vs N0) | 2.338(1.352,4.042) | 2.37E-03 | 1.218(0.664,2.236) | 0.523547 |
| pM (M1 vs M0) | 4.864(1.961,12.066) | 0.000642 | ||
| Grade(high vs low) | 21.188(0.019,23176.048) | 0.39241 | ||
| 14-marker-based classifier (high risk vs low risk) | 2.588(1.526,4.387) | 4.16E-04 | 2.005(1.091,3.685) | 0.025003 |
| Whole cohort | ||||
| Age (>60 vs ≤60) | 1.897(1.287,2.794) | 0.001206 | 1.604(0.799,3.223) | 0.184 |
| Gender(male vs female) | 0.88(0.635,1.217) | 0.439 | ||
| Subtype (Papillary vs Non-Papillary) | 0.655(0.459,0.933) | 0.018962 | 0.992(0.541,1.82) | 0.98 |
| pT (T3-4 vs T0-2) | 2.14(1.472,3.111) | 0.000067 | 1.489(0.745,2.978) | 0.26 |
| pN (N1-3 vs N0) | 2.268(1.656,3.105) | 3.29E-07 | 1.248(0.718,2.17) | 0.432 |
| pM (M1 vs M0) | 3.305(1.579,6.915) | 0.001507 | 1.612(0.589,4.413) | 0.352 |
| Grade(high vs low) | 2.926(0.724,11.829) | 0.131854 | ||
| 14-marker-based classifier (high risk vs low risk) | 3.526(2.537,4.901) | 6.26E-14 | 3.976(2.192,7.211) | 6.00E-06 |
Table 5. Univariate and multivariate Cox regression analysis of the 12-marker-based classifier with RFS in training cohort, validation cohort and whole cohort.
| Parameters | Univariate COX | Multivariate COX | ||
| HR (95% CI) | P | HR (95% CI) | P | |
| Training cohort | ||||
| Age (>60 vs ≤60) | 2.055(1.005,4.202) | 0.048360973 | 1.239(0.451,3.404) | 0.678047 |
| Gender(male vs female) | 0.880(0.454,1.707) | 0.704943796 | ||
| Subtype (Papillary vs Non-Papillary) | 1.357(0.733,2.510) | 0.331186056 | ||
| pT (T3-4 vs T0-2) | 2.337(1.166,4.685) | 0.016743034 | 1.636(0.635,4.212) | 0.307782 |
| pN (N1-3 vs N0) | 2.576(1.482,4.477) | 0.00079688 | 1.467(0.624,3.449) | 0.379187 |
| M (M1 vs M0) | 6.003(1.757,20.512) | 0.004255841 | 3.330(0.384,28.905) | 0.275237 |
| Grade(high vs low) | 2.135(0.294,15.528) | 0.453562546 | ||
| 12-marker-based classifier (high risk vs low risk) | 5.607(2.885,10.898) | 0.000000368 | 3.364(1.349,8.384) | 0.00924 |
| Validation cohort | ||||
| Age (>60 vs ≤60) | 0.581(0.286,1.180) | 0.133271407 | ||
| Gender(male vs female) | 1.124(0.527,2.399) | 0.761624713 | ||
| Subtype (Papillary vs Non-Papillary) | 0.341(0.130,0.891) | 0.028126777 | 0.492(0.099,2.437) | 0.384909 |
| pT (T3-4 vs T0-2) | 2.379(1.003,5.646) | 0.049252702 | 34614.538(0,4.777E+157) | 0.953672 |
| pN (N1-3 vs N0) | 2.792(1.227,6.352) | 0.014351444 | 1.644(0.433,6.247) | 0.466 |
| M (M1 vs M0) | 6.121(0.684,54.771) | 0.105160081 | 4.189(0.334,52.541) | 0.26697 |
| Grade(high vs low) | 22.506(0.029,17274.179) | 0.35827 | ||
| 12-marker-based classifier (high risk vs low risk) | 2.941(1.353,6.394) | 0.006477803 | 9.857(1.212,80.2) | 0.032403 |
| Whole cohort | ||||
| Age (>60 vs ≤60) | 1.168(0.724,1.883) | 0.525022 | ||
| Gender(male vs female) | 0.986(0.603,1.614) | 0.956337 | ||
| Subtype (Papillary vs Non-Papillary) | 0.58(0.346,0.969) | 0.038 | 0.694(0.322,1.494) | 0.351 |
| pT (T3-4 vs T0-2) | 2.319(1.351,3.981) | 0.00229 | 1.835(0.661,5.095) | 0.244 |
| pN (N1-3 vs N0) | 2.647(1.681,4.17) | 0.000027 | 1.537(0.769,3.072) | 0.224 |
| M (M1 vs M0) | 5.815(2.003,16.885) | 0.001208 | 3.808(0.809,17.927) | 0.091 |
| Grade(high vs low) | 4.044(0.561,29.136) | 0.165449 | ||
| 12-marker-based classifier (high risk vs low risk) | 4.212(2.552,6.953) | 1.88E-08 | 3.816(1.698,8.571) | 0.001 |
In clinical practice, the most commonly used risk classification is TNM staging. Therefore, the association between the lncRNA-based classifier models and TNM staging was explored. The ROC curve analysis compared TNM staging with the lncRNA-based classifier models which had an obvious better predictive accuracy. The results indicated that the combination of the lncRNA-based classifier models and TNM staging could enhance the ability to predict prognosis of survival and recurrence (Figure 5C, 5D). The Kaplan–Meier curves revealed that patients separated by combining the lncRNA-based risk scores and TNM staging had evidently discrepant prognoses (p< 0.0001, Figure 5E, 5F).
Discussion
Patients with BLCA, especially muscle-invasive bladder cancer (MIBC), still have significant risks of relapse and death, in spite of radical cystectomy [4, 6, 18, 19]. To a certain extent, the aggressiveness of BLCA cannot be accurately stratified by the TNM staging system, which mostly depends on the pathological staging without any molecular biological features [20, 21]. On that account, finding new and effective prognostic biomarkers is critical for patients with MIBC due to the disappointing clinical outcomes.
Increasing evidence has demonstrated that dysregulated lncRNAs may contribute to cancer initiation, progression and metastasis [22]. Several lncRNA-based signatures have been applied to predict the risk of cancer progression in patients with different cancer types, such as renal cell carcinoma [14] and colon cancer [15]. As for BLCA, although the prognostic value of lncRNAs has also been explored by some authors [17, 23], there are still many things to be improved. The reasons for this are the following: (1) the internal validation dataset is needed to validate the stability of the constructed model; (2) the comparison between the constructed model and the existing TNM staging system is indispensable; (3) the prognostic value of BLCA recurrence should be further explored. Therefore, in this study, based on a TCGA-BLCA cohort, we established and validated novel prognostic lncRNA-based signatures for OS and RFS, in order to improve the prediction of mortality and disease recurrence. The LASSO-Cox regression mode, as a popular tool for regression with high-dimensional predictors, has previously been performed in the study of colon cancer but has not been applied yet to the study of BLCA. Thus, in this study, the LASSO-Cox regression mode was applied as an effort to optimally select lncRNAs with high expression variances, significant prognostic values and low correlation by using LASSO penalization. A 14-lncRNA-based classifier for OS and a 12-lncRNA-based classifier for RFS were constructed and validated to optimize the predictive ability of prognosis for BLCA patients. The results indicated that the two classifiers could successfully divide BLCA patients into high/low-risk groups with significant differences in OS and RFS in training cohorts. The prognostic value of the two classifiers could be confirmed in validation cohorts, indicating the repeatability and practicability of the two lncRNA-based classifiers for the prognostic prediction for OS and RFS. As shown in Table 2 and Table 3, the 14-marker-based classifier, age, pT, pN and pM were significantly associated with OS, while the 12-marker-based classifier, subtype, pT, pN and pM were significantly associated with RFS in univariate Cox regression analyses. In multivariate Cox regression analyses, only the 14-lncRNA-based classifier model was retained to be a dependable and independent prognostic factor for OS (p < 0.001) and only the 12-lncRNA-based classifier model could qualify as a novel and independent prognostic factor for RFS (p = 0.001). In clinical practice, the most used risk classification is TNM staging. Next, the association between the lncRNA-based classifier models and TNM staging were explored. In the ROC curve analysis, compared TNM staging, the lncRNA-based classifier models had an obviously better predictive accuracy, and the combination of the lncRNA-based classifier models and TNM staging could enhance the ability to predict prognosis of survival and recurrence. The Kaplan–Meier curves revealed that patients separated by both the lncRNA-based risk scores and TNM staging had evidently discrepant prognoses.
Our study has showed that the 14-lncRNA-based classifier for OS and the 12-lncRNA-based classifier for RFS were both strongly associated with the prognosis of BLCA. However, most of the lncRNAs in our classifiers have not been completely clarified and functionally annotated. On the other hand, several lncRNAs used in our classifiers have been explored in previous studies. MAFG-AS1 has been shown to function as a ceRNA to increase the expression of MMP15 and NDUFA4. It does so by competing for miR-339-5p and miR-147b, thus exerting its oncogenic function in non-small- cell carcinoma [24] and colorectal cancer [25]. LINC01138 induces malignancies via activating arginine methyltransferase 5 and interacting with PRMT5 to promote SREBP1-mediated lipid desaturation individually in hepatocellular carcinoma [26] and clear cell renal cell carcinoma [27]. Given their strong relevance to prognosis, these genes should be explored in the future, especially in relation to BLCA.
Inevitably, the present study has some innate limitations which need to be addressed. Firstly, the current study was of a retrospective nature, since it was based on data from TCGA dataset without validating it in a prospective clinical trial. Secondly, the mechanism behind the lncRNAs in our classifiers remains entirely unclear. Hence, the need for further studies of the specific lncRNAs is indisputable, as they can contribute to a distinct understanding of the implication of lncRNAs in BLCA initiation and progression. Moreover, the information regarding several important clinicopathological features, such as treatments, was not available in the TCGA-BLCA cohort. Despite these drawbacks, the results demonstrate that our lncRNA-based classifiers could be used as reliable prognostic predictors of BLCA survival and recurrence.
In summary, a 14-lncRNA-based classifier for OS and a 12-lncRNA-based classifier for RFS were constructed using the LASSO Cox regression model. These classifiers could be novel and independent prognostic factors for OS and RFS respectively, while optimizing the predictive ability of the current (TNM) staging system. Nevertheless, future, large-scale, multi-center studies are necessary to confirm our results before the lncRNA-based signatures can be applied in the clinic.
Materials and Methods
Patient datasets
TCGA-BLCA RNA sequencing dataset and corresponding clinical characteristics of patients were downloaded from the TCGA website (https://cancergenome.nih.gov/), including 414 BLCA tissues and 19 adjacent non-tumor tissues. The RFS data was downloaded from the UCSC Xena website (https://xena.ucsc.edu/). We excluded the lncRNA whose expression (read counts) was “zero” in 90% of the BLCA patients.
Data processing
BLCA data were annotated by Gencode (GENCODE v 26) GTF file in this study. As shown in Figure 1, we used edgeR for the entire data in order to identify the differentially expressed lncRNAs(DElncRNAs) with |logFC| >1 and padj < 0.05 between tumor and normal samples. Meanwhile, we conducted a univariate Cox regression for all lncRNAs in cancer samples and chose the lncRNAs with p < 0.05 for the next analysis. The DElncRNAs with |logFC| >1 and padj < 0.05 were retained to determine their overlap with lncRNAs with p < 0.05 in the univariate Cox regression. Afterwards, these samples were randomly split into training and validation sets at a 2:1 ratio. Following this, we applied the LASSO Cox selection method at 20-fold cross-validation to construct the survival-predicting models. The predictive ability of the model for the training, validation and whole cohorts were evaluated by the Kaplan–Meier log-rank test, Time-dependent ROC curve analysis and multivariate Cox regression analysis.
Construction of lncRNAs signature and statistical analysis
The lncRNAs-based prognosis risk score was constructed based on a linear combination of the expression level multiplied regression model (β) and the LASSO Cox selection method [28–30] at 20-fold cross-validation. Based on the cut-off of the median risk score, BLCA patients were divided into high- and low-risk groups. The Kaplan-Meier survival curves for the cases predicted to have low or high risk were produced. All the analyses were implemented in SPSS version 23.0 or R version 3.5.2 with the following packages: ‘edgeR’, ‘glmnet’, ‘survivalROC’ and ‘gplot’. All the hypotheses were two-sided and P < 0.05 was considered statistically significant.
Abbreviations
BLCA: Bladder Cancer; LncRNA: Long non-coding RNA; OS: Overall Survival; RFS: Relapse-Free Survival; LASSO: Least Absolute Shrinkage and Selection Operation; ROC: Receiver Operating Characteristic; AUC: Area Under Curve; TCGA: The Cancer Genome Atlas; MIBC: Muscle-Invasive Bladder Cancer.
Author Contributions
A.H and S.H: design, analysis and interpretation of data, drafting of the manuscript, critical revision of the manuscript; A.H, D.P and Y.Z statistical analysis; Y.L and Z.C: acquisition of data; Y. G, X.L and L.Z: critical revision of the manuscript for important intellectual content, administrative support, obtaining funding, supervision. All authors read and approved the final manuscript.
Conflicts of Interest
The authors declare that there are no conflicts of interest concerning this article.
Funding
This work was supported by the National Natural Science Foundation of China [81672546, 81602253, 81772703, 81872083], Natural Science Foundation of Beijing [7152146, 7172219] and The Capital Health Research and Development of Special [2016–1-4077].
References
- 1. Antoni S, Ferlay J, Soerjomataram I, Znaor A, Jemal A, Bray F. Bladder Cancer Incidence and Mortality: A Global Overview and Recent Trends. Eur Urol. 2017; 71:96–108. https://doi.org/10.1016/j.eururo.2016.06.010 [PubMed]
- 2. Siegel RL, Miller KD, Jemal A. Cancer statistics, 2018. CA Cancer J Clin. 2018; 68:7–30. https://doi.org/10.3322/caac.21442 [PubMed]
- 3. Cumberbatch MG, Jubber I, Black PC, Esperto F, Figueroa JD, Kamat AM, Kiemeney L, Lotan Y, Pang K, Silverman DT, Znaor A, Catto JW. Epidemiology of Bladder Cancer: A Systematic Review and Contemporary Update of Risk Factors in 2018. Eur Urol. 2018; 74:784–95. https://doi.org/10.1016/j.eururo.2018.09.001 [PubMed]
- 4. Alfred Witjes J, Lebret T, Compérat EM, Cowan NC, De Santis M, Bruins HM, Hernández V, Espinós EL, Dunn J, Rouanne M, Neuzillet Y, Veskimäe E, van der Heijden AG, et al. Updated 2016 EAU Guidelines on Muscle-invasive and Metastatic Bladder Cancer. Eur Urol. 2017; 71:462–75. https://doi.org/10.1016/j.eururo.2016.06.020 [PubMed]
- 5. Robertson AG, Kim J, Al-Ahmadie H, Bellmunt J, Guo G, Cherniack AD, Hinoue T, Laird PW, Hoadley KA, Akbani R, Castro MAA, Gibb EA, Kanchi RS, et al. Comprehensive Molecular Characterization of Muscle-Invasive Bladder Cancer. Cell. 2017; 171:540–556.e525. https://doi.org/10.1016/j.cell.2017.09.007 [PubMed]
- 6. Chang SS, Boorjian SA, Chou R, Clark PE, Daneshmand S, Konety BR, Pruthi R, Quale DZ, Ritch CR, Seigne JD, Skinner EC, Smith ND, McKiernan JM. Diagnosis and Treatment of Non-Muscle Invasive Bladder Cancer: AUA/SUO Guideline. J Urol. 2016; 196:1021–29. https://doi.org/10.1016/j.juro.2016.06.049 [PubMed]
- 7. Kluth LA, Black PC, Bochner BH, Catto J, Lerner SP, Stenzl A, Sylvester R, Vickers AJ, Xylinas E, Shariat SF. Prognostic and Prediction Tools in Bladder Cancer: A Comprehensive Review of the Literature. Eur Urol. 2015; 68:238–53. https://doi.org/10.1016/j.eururo.2015.01.032 [PubMed]
- 8. Hao X, Luo H, Krawczyk M, Wei W, Wang W, Wang J, Flagg K, Hou J, Zhang H, Yi S, Jafari M, Lin D, Chung C, et al. DNA methylation markers for diagnosis and prognosis of common cancers. Proc Natl Acad Sci USA. 2017; 114:7414–19. https://doi.org/10.1073/pnas.1703577114 [PubMed]
- 9. Peng D, Ge G, Xu Z, Ma Q, Shi Y, Zhou Y, Gong Y, Xiong G, Zhang C, He S, He Z, Li X, Ci W, Zhou L. Diagnostic and prognostic biomarkers of common urological cancers based on aberrant DNA methylation. Epigenomics. 2018; 10:1189–99. https://doi.org/10.2217/epi-2018-0017 [PubMed]
- 10. Xu RH, Wei W, Krawczyk M, Wang W, Luo H, Flagg K, Yi S, Shi W, Quan Q, Li K, Zheng L, Zhang H, Caughey BA, et al. Circulating tumour DNA methylation markers for diagnosis and prognosis of hepatocellular carcinoma. Nat Mater. 2017; 16:1155–61. https://doi.org/10.1038/nmat4997 [PubMed]
- 11. Brooks SA, Brannon AR, Parker JS, Fisher JC, Sen O, Kattan MW, Hakimi AA, Hsieh JJ, Choueiri TK, Tamboli P, Maranchie JK, Hinds P, Miller CR, et al. ClearCode34: A prognostic risk predictor for localized clear cell renal cell carcinoma. Eur Urol. 2014; 66:77–84. https://doi.org/10.1016/j.eururo.2014.02.035 [PubMed]
- 12. Rini B, Goddard A, Knezevic D, Maddala T, Zhou M, Aydin H, Campbell S, Elson P, Koscielny S, Lopatin M, Svedman C, Martini JF, Williams JA, et al. A 16-gene assay to predict recurrence after surgery in localised renal cell carcinoma: development and validation studies. Lancet Oncol. 2015; 16:676–85. https://doi.org/10.1016/S1470-2045(15)70167-1 [PubMed]
- 13. Yu SL, Chen HY, Chang GC, Chen CY, Chen HW, Singh S, Cheng CL, Yu CJ, Lee YC, Chen HS, Su TJ, Chiang CC, Li HN, et al. MicroRNA signature predicts survival and relapse in lung cancer. Cancer Cell. 2008; 13:48–57. https://doi.org/10.1016/j.ccr.2007.12.008 [PubMed]
- 14. Qu L, Wang ZL, Chen Q, Li YM, He HW, Hsieh JJ, Xue S, Wu ZJ, Liu B, Tang H, Xu XF, Xu F, Wang J, et al. Prognostic Value of a Long Non-coding RNA Signature in Localized Clear Cell Renal Cell Carcinoma. Eur Urol. 2018; 74:756–63. https://doi.org/10.1016/j.eururo.2018.07.032 [PubMed]
- 15. Dai W, Feng Y, Mo S, Xiang W, Li Q, Wang R, Xu Y, Cai G. Transcriptome profiling reveals an integrated mRNA-lncRNA signature with predictive value of early relapse in colon cancer. Carcinogenesis. 2018; 39:1235–44. https://doi.org/10.1093/carcin/bgy087 [PubMed]
- 16. Martens-Uzunova ES, Böttcher R, Croce CM, Jenster G, Visakorpi T, Calin GA. Long noncoding RNA in prostate, bladder, and kidney cancer. Eur Urol. 2014; 65:1140–51. https://doi.org/10.1016/j.eururo.2013.12.003 [PubMed]
- 17. He RQ, Huang ZG, Li TY, Wei YP, Chen G, Lin XG, Wang QY. RNA-Sequencing Data Reveal a Prognostic Four-lncRNA-Based Risk Score for Bladder Urothelial Carcinoma: An in Silico Update. Cell Physiol Biochem. 2018; 50:1474–95. https://doi.org/10.1159/000494647 [PubMed]
- 18. Burger M, Catto JW, Dalbagni G, Grossman HB, Herr H, Karakiewicz P, Kassouf W, Kiemeney LA, La Vecchia C, Shariat S, Lotan Y. Epidemiology and risk factors of urothelial bladder cancer. Eur Urol. 2013; 63:234–41. https://doi.org/10.1016/j.eururo.2012.07.033 [PubMed]
- 19. Woldu SL, Bagrodia A, Lotan Y. Guideline of guidelines: non-muscle-invasive bladder cancer. BJU Int. 2017; 119:371–80. https://doi.org/10.1111/bju.13760 [PubMed]
- 20. Bladder cancer: diagnosis and management of bladder cancer: © NICE (2015) Bladder cancer: diagnosis and management of bladder cancer. BJU Int. 2017; 120:755–65. https://doi.org/10.1111/bju.14045 [PubMed]
- 21. Ward JF, Margulis V. Continous improvement of TNM staging system for bladder cancer. Cancer. 2009; 115:704–05. https://doi.org/10.1002/cncr.24112 [PubMed]
- 22. Huarte M. The emerging role of lncRNAs in cancer. Nat Med. 2015; 21:1253–61. https://doi.org/10.1038/nm.3981 [PubMed]
- 23. Zhu N, Hou J, Wu Y, Liu J, Li G, Zhao W, Ma G, Chen B, Song Y. Integrated analysis of a competing endogenous RNA network reveals key lncRNAs as potential prognostic biomarkers for human bladder cancer. Medicine (Baltimore). 2018; 97:e11887. https://doi.org/10.1097/MD.0000000000011887 [PubMed]
- 24. Jia YC, Wang JY, Liu YY, Li B, Guo H, Zang AM. LncRNA MAFG-AS1 facilitates the migration and invasion of NSCLC cell via sponging miR-339-5p from MMP15. Cell Biol Int. 2019; 43:384–93. https://doi.org/10.1002/cbin.11092 [PubMed]
- 25. Cui S, Yang X, Zhang L, Zhao Y, Yan W. LncRNA MAFG-AS1 promotes the progression of colorectal cancer by sponging miR-147b and activation of NDUFA4. Biochem Biophys Res Commun. 2018; 506:251–58. https://doi.org/10.1016/j.bbrc.2018.10.112 [PubMed]
- 26. Li Z, Zhang J, Liu X, Li S, Wang Q, Di Chen, Hu Z, Yu T, Ding J, Li J, Yao M, Fan J, Huang S, et al. The LINC01138 drives malignancies via activating arginine methyltransferase 5 in hepatocellular carcinoma. Nat Commun. 2018; 9:1572. https://doi.org/10.1038/s41467-018-04006-0 [PubMed]
- 27. Zhang X, Wu J, Wu C, Chen W, Lin R, Zhou Y, Huang X. The LINC01138 interacts with PRMT5 to promote SREBP1-mediated lipid desaturation and cell growth in clear cell renal cell carcinoma. Biochem Biophys Res Commun. 2018; 507:337–42. https://doi.org/10.1016/j.bbrc.2018.11.036 [PubMed]
- 28. Tibshirani R. The lasso method for variable selection in the Cox model. Stat Med. 1997; 16:385–95. https://doi.org/10.1002/(SICI)1097-0258(19970228)16:4<385::AID-SIM380>3.0.CO;2-3 [PubMed]
- 29. Zhang HH, Lu WB. Adaptive lasso for Cox’s proportional hazards model. Biometrika. 2007; 94:691–703. https://doi.org/10.1093/biomet/asm037
- 30. Tibshirani R. Regression shrinkage and selection via the lasso: a retrospective. J R Stat Soc B. 2011; 73:273–82. https://doi.org/10.1111/j.1467-9868.2011.00771.x