


Introduction
Stroke is a leading cause of morbidity and mortality worldwide independent of socioeconomic conditions [1]. Among all subtypes of stroke, 85% of deaths by stroke are attributed to ischaemic stroke (IS). This disease is promoted by multiple factors, such as genetics, hypertension, tobacco smoking, and diabetes [2]. Most IS cases are attributed to atherosclerosis, which is characterized by chronic inflammation of the vascular wall.
The ADAMTS family includes 19 proteases with multiple domains, disintegrin, and metalloproteinase activity, all of which feature thrombospondin-like motifs. This family prominently intervenes in several pathophysiological phenomena, such as remodeling of the extracellular matrix (ECM), angiogenesis, hemostasis, organogenesis, arthritis, and cancer [3]. ADAMTS proteinases have been observed to promote atherosclerosis in recent research [3, 4].
ADAMTS7’s structure includes a signal peptide, prodomain, metalloproteinase domain, disintegrin-like domain, as well as numerous thrombospondin type I repeats (TSP1) interspersed by spacer domains [5]. Cleavage of the ADAMTS7 propeptide is required for the maturation of ADAMTS7 [6]. Thrombospondin-5 (TSP 5,alsoor COMP) is the most well-known substrate of ADAMTS7 [7]. COMP is typically found in the ECM in chondral tissue and vessel walls, as well as in atherosclerotic and restenotic lesions, delineating its probable involvement in the pathophysiology of ECM remodeling [7]. Additional studies have indicated that ADAMTS7 promotes migration of vascular smooth muscle cells (VSMC) and hyperplasia of the intima layer via degradation of the inhibitory matrix protein COMP [7]. Functional ADAMTS7 is capable of impairing endothelial repair by degrading thrombospondin-1, resulting in impairment of both growth and migration of endothelial cells [8]. Recent in vivo evidence indicates mice lacking ADAMTS7 display diminished neointimal thickening, likely caused by reduced VSMC migration [9]. Furthermore, ADAMTS7 is expressed in human plaques at all stages, and higher ADAMTS7 levels correlate with a vulnerable plaque phenotype and increased risk for postoperative cardiovascular events [10]. Based on these findings, we hypothesize ADAMTS7 participate in the pathogenesis of IS.
In large-scale genome-wide association (GWA) investigations, variants of the ADAMTS7 gene have been related to an increased risk of coronary artery disease (CAD) [11–14]. The rs3825807 (A/G) variant—a CAD-associated single-nucleotide polymorphism (SNP)—recently, has become the center of attention, as it is associated with an exchange of serine for proline in the ADAMTS7 prodomain with decreased processing of this structure [15]. Accumulating evidence from functional research suggests the rs3825807 variant in the coding region of ADAMTS7 is functionally essential for the maturation of ADAMTS7 and the migration of VSMC [4, 15].
The ADAMTS7 rs3825807 A allele has been associated with potentiation of VSMC migration and neointimal thickening, as well as the promotion of atherosclerosis and plaque rupture [16]. A recent study performed by Chan et al. demonstrated that CAD patients carrying the ADAMTS7 rs3825807 G allele display atherosclerotic plaques with more stability as assessed by histopathology, better angiographic results, and a lower risk of revascularization at follow-up [17]. However, the ADAMTS7-IS relationship requires further exploration. In light of the potential role of ADAMTS7 in IS pathophysiology, we aimed to elucidate whether ADAMTS7 variations are significantly linked with IS risk and, if so, what is the impact of these variants on the expression of ADAMTS7.
Results
Demographics
A total of 2547 participants were enrolled; 1279 IS patients and 1268 healthy controls (Table 1). In two cohorts of our study, smoking, diabetes, and hypertension were significantly more frequent in the IS group. IS patients also had higher homocysteine (HCY), and lower high-density lipoprotein (HDL) cholesterol levels in two cohorts. No significant differences were found regarding age, serum uric acid, low-density lipoprotein (LDL) cholesterol, and total cholesterol between groups in two cohorts. Significant gender and triglycerides level differences were observed between IS patients and control in the initial cohort, whereas no differences regarding gender and triglycerides level were found between groups in the replication cohort.
Table 1. Characteristics of ischemic stroke cases and controls.
| Variables | Initial cohort | Replication cohort | |||||||||||||||||||||||||||||||||||||||||||||||||||||||||||||||||||||||||||||||||||||||||||||||||
| IS (n=615) | control (n=615) | P value | IS (n=664) | control (n=653) | P value | ||||||||||||||||||||||||||||||||||||||||||||||||||||||||||||||||||||||||||||||||||||||||||||||
| Mean age (years) | 62.47±9.89 | 61.53±8.91 | 0.11 | 68.3±9.52 | 67.8±8.86 | 0.53 | |||||||||||||||||||||||||||||||||||||||||||||||||||||||||||||||||||||||||||||||||||||||||||||
| Male/female | 408/207 | 311/304 | < 0.001 | 441/223 | 403/250 | 0.22 | |||||||||||||||||||||||||||||||||||||||||||||||||||||||||||||||||||||||||||||||||||||||||||||
| Smokers, n (%) | 167 (27.2) | 73 (11.9) | < 0.001 | 168 (25.3) | 112 (17.2) | < 0.001 | |||||||||||||||||||||||||||||||||||||||||||||||||||||||||||||||||||||||||||||||||||||||||||||
| Hypertension, n (%) | 466 (75.8) | 199 (32.4) | < 0.001 | 425 (64.0) | 154 (23.6) | < 0.001 | |||||||||||||||||||||||||||||||||||||||||||||||||||||||||||||||||||||||||||||||||||||||||||||
| Diabetes, n (%) | 184 (29.9) | 51 (8.3) | < 0.001 | 179 (27.0) | 60 (9.2) | < 0.001 | |||||||||||||||||||||||||||||||||||||||||||||||||||||||||||||||||||||||||||||||||||||||||||||
| uric acid (mmol/L) | 319.8±88.4 | 322.1±90.9 | 0.72 | 336.4±78.3 | 328.2±84.5 | 0.32 | |||||||||||||||||||||||||||||||||||||||||||||||||||||||||||||||||||||||||||||||||||||||||||||
| Total cholesterol (mmol/L) | 5.07±1.18 | 5.06±0.99 | 0.94 | 5.14±1.23 | 5.08±1.05 | 0.58 | |||||||||||||||||||||||||||||||||||||||||||||||||||||||||||||||||||||||||||||||||||||||||||||
| Triglycerides (mmol/L) | 1.62±1.09 | 1.42±0.97 | < 0.001 | 1.54±0.98 | 1.55±1.24 | 0.51 | |||||||||||||||||||||||||||||||||||||||||||||||||||||||||||||||||||||||||||||||||||||||||||||
| HDL-cholesterol (mmol/L) | 1.30±0.64 | 1.41±0.42 | < 0.001 | 1.32±0.57 | 1.55±0.83 | < 0.001 | |||||||||||||||||||||||||||||||||||||||||||||||||||||||||||||||||||||||||||||||||||||||||||||
| LDL-cholesterol (mmol/L) | 3.07±1.03 | 3.01±0.97 | 0.42 | 3.21±0.98 | 3.18±0.95 | 0.36 | |||||||||||||||||||||||||||||||||||||||||||||||||||||||||||||||||||||||||||||||||||||||||||||
| HCY (mmol/L) | 11.60±6.06 | 10.33±3.33 | < 0.001 | 12.36±4.85 | 10.52±2.56 | < 0.001 | |||||||||||||||||||||||||||||||||||||||||||||||||||||||||||||||||||||||||||||||||||||||||||||
| HDL-cholesterol: high-density lipoprotein cholesterol; LDL: low-density lipoprotein cholesterol; HCY: Homocysteine | |||||||||||||||||||||||||||||||||||||||||||||||||||||||||||||||||||||||||||||||||||||||||||||||||||
| Continuous data are presented as the mean ± SD, median (range) or n (%). | |||||||||||||||||||||||||||||||||||||||||||||||||||||||||||||||||||||||||||||||||||||||||||||||||||
| aP < 0.05 is indicated in bold font. | |||||||||||||||||||||||||||||||||||||||||||||||||||||||||||||||||||||||||||||||||||||||||||||||||||
ADAMTS7 variants and IS risk
Table 2 depicts the frequencies of the ADAMTS7 genotype and allele variants. The assessed variants did not deviate from Hardy-Weinberg equilibrium (P > 0.05). Figure 1 shows the linkage pattern of polymorphism within the ADAMTS7 gene. In the initial cohort, genotypic association analyses between IS patients and control revealed a statistical association between the rs3825807 and rs11634042 variants with IS risk (P = 0.0073 and P = 0.0071, respectively). This significant association was further confirmed in the replication cohort (P = 0.037 and P = 0.035, respectively). In a dominant model (AA vs. AG/GG and CC vs. CT/TT), significant differences in the frequency were observed for rs3825807 (P = 0.0040 in the initial cohort and P = 0.024 in the replication cohort) and rs11634042 (P = 0.0048 in the initial cohort and P = 0.026 in the replication cohort) in IS patients compared to the control group. In contrast, the recessive model did not identify significant differences between either the IS group or control group for the two variants (rs3825807 and rs11634042). However, in combined cohort, the recessive model showed a significant difference in IS patients compared with controls for rs3825807 and rs11634042 (P = 0.031 and P = 0.015, respectively). The frequencies of the variant G allele at rs3825807 (P = 0.0040 in the initial cohort and P = 0.024 in the replication cohort) and the variant T allele atrs11634042 (P = 0.0048 in the initial cohort and P = 0.026 in the replication cohort) were significantly greater in the IS group than in the control group. We did, however, find significant differences in the genotypic and allelic distributions of the rs7173743 variant of IS patients and the control group in two cohorts (P = 0.013 in the initial cohort and P = 0.025 in the replication cohort). Likewise, the dominant model (TT vs TC/CC) revealed a significant difference in rs7173743 frequency in IS patients in comparison with controls (P = 0.046 in the initial cohort and P = 0.047 in the replication cohort). In addition, the recessive model (TT/TC vs CC) also showed a significant difference in IS patients compared with controls (P = 0.013 in the initial cohort and P = 0.020 in the replication cohort). The frequency of the variant C allele at rs7173743 was significantly different in the IS group compared with the control group (P = 0.012 and P = 0.020 in the replication cohort). No statistical association was recognized between the rs4380028 variant and IS risk. Moreover, the same trend was observed for the heterozygous mutation after Bonferroni correction in combined cohort, which confirms the findings in both initial cohort and replication cohort. Since no significant heterogeneity in allele distribution between the two cohorts was detected, the two cohorts were combined for the subsequent analysis.
Table 2. Genotype and allele frequencies of ADAMTS7 variants between IS patients and controls, and corresponding ORs for IS.
| Genotype & Allele | Initial cohort | Replication cohort | Combined cohort | |||||||
| IS patients (n=615) | Controls (n=615) | OR (95% CI) | P valuea | IS patients (n=664) | Controls (n=653) | OR (95% CI) | P valuea | OR (95% CI) | P valuea | |
| rs3825807 | ||||||||||
| AA | 462(75.1) | 412(67.0) | 0.0073 | 492(74.4) | 443(67.8) | 0.037 | 2.4×10⁻⁴ | |||
| AG | 140(22.8) | 181(29.4) | 158(23.8) | 187(28.7) | ||||||
| GG | 13(2.1) | 22(3.6) | 14(1.8) | 23(3.5) | ||||||
| AA vs AG/GG | 153(24.9) | 203(33.0) | 0.67(0.52-0.86) | 0.0040 | 172 (25.9) | 210 (32.2) | 0.74(0.58-0.94) | 0.024 | 0.71(0.59-0.84) | 1.3×10⁻⁴ |
| AA/AG vs GG | 602(97.9) | 593(96.4) | 0.58(0.29-1.17) | 0.17 | 650 (97.9) | 630 (96.5) | 0.59(0.30-1.16) | 0.11 | 0.59(0.36-0.95) | 0.031 |
| A | 1064(86.5) | 1005(81.7) | 1142(86.0) | 1073(82.2) | ||||||
| G | 166(13.5) | 225(18.3) | 0.70(0.56-0.87) | 0.0040 | 186 (14.0) | 233 (17.8) | 0.75(0.61-0.93) | 0.024 | 0.72(0.62-0.84) | 1.2×10⁻⁴ |
| rs11634042 | ||||||||||
| CC | 464(75.4) | 415(67.5) | 0.0071 | 496(74.7) | 448(68.6) | 0.035 | 2.0×10⁻⁴ | |||
| CT | 139(22.6) | 178(28.9) | 155(23.3) | 182(27.9) | ||||||
| TT | 12(2.0) | 22(3.6) | 13(2.0) | 23(3.5) | ||||||
| CC vs CT/TT | 151(24.6) | 200(32.5) | 0.68(0.53-0.87) | 0.0048 | 168(25.3) | 205(34.5) | 0.75(0.59-0.95) | 0.026 | 0.71(0.60-0.84) | 1.8×10⁻⁴ |
| CC/CT vs TT | 603(98.0) | 593(96.4) | 0.54(0.26-1.09) | 0.12 | 651(98.0) | 630(96.5) | 0.55(0.27-1.09) | 0.077 | 0.54(0.33-0.89) | 0.015 |
| C | 1067(86.7) | 1008(82.0) | 1147(86.4) | 1078(82.5) | ||||||
| T | 163(13.3) | 222(18.0) | 0.69(0.56-0.86) | 0.0048 | 181(13.6) | 228(17.5) | 0.75(0.60-0.92) | 0.026 | 0.72(0.62-0.84) | 1.0×10⁻⁴ |
| rs4380028 | ||||||||||
| CC | 211(34.3) | 188(30.6) | 0.48 | 233(35.1) | 207(31.7) | 0.27 | 0.14 | |||
| CT | 296(48.1) | 309(50.2) | 316(47.6) | 314(48.1) | ||||||
| TT | 108(17.6) | 118(19.2) | 115(17.3) | 132(20.2) | ||||||
| CC vs CT/TT | 404(65.7) | 427(69.4) | 0.84(0.66-1.07) | 0.38 | 431(64.9) | 446(68.3) | 0.86(0.68-1.08) | 0.25 | 0.85(0.72-1.00) | 0.12 |
| CC/CT vs TT | 507(82.4) | 497(80.8) | 0.90(0.67-1.20) | 0.51 | 549(82.7) | 521(79.8) | 0.83(0.63-1.09) | 0.25 | 0.86(0.70-1.05) | 0.14 |
| C | 718(58.4) | 685(55.7) | 782(58.9) | 728(55.7) | ||||||
| T | 512(41.6) | 545(44.3) | 0.90(0.76-1.05) | 0.38 | 546(41.1) | 578(44.3) | 0.88(0.75-1.03) | 0.25 | 0.89(0.79-0.99) | 0.12 |
| rs7173743 | ||||||||||
| TT | 166(27.0) | 135(22.0) | 0.013 | 186(28.0) | 152(23.3) | 0.025 | 2.5×10⁻⁴ | |||
| TC | 309(50.2) | 297(48.3) | 330(49.7) | 315(48.2) | ||||||
| CC | 140(22.8) | 183(29.7) | 148(22.3) | 186(28.5) | ||||||
| TT vs TC/CC | 449(73.0) | 480(78.0) | 0.76(0.59-0.99) | 0.046 | 478(72.0) | 501(76.7) | 0.78(0.61-1.00) | 0.047 | 0.77(0.64-0.92) | 0.0046 |
| TT/TC vs CC | 475(77.2) | 432(70.3) | 0.70(0.54-0.90) | 0.013 | 516(77.7) | 467(71.5) | 0.72(0.56-0.92) | 0.020 | 0.71(0.59-0.85) | 2.5×10⁻⁴ |
| T | 641(52.1) | 567(46.0) | 702(52.9) | 619(47.4) | ||||||
| C | 589(47.9) | 663(54.0) | 0.79(0.67-0.92) | 0.012 | 626(47.1) | 687(52.6) | 0.80(0.69-0.94) | 0.020 | 0.79(0.71-0.89) | 1.7×10⁻⁴ |
Data are presented as number (%).
a adjusted for age, gender, smoking, hypertension, diabetes mellitus and hyperlipidaemia.
P value under 0.05 were indicated in bold font.
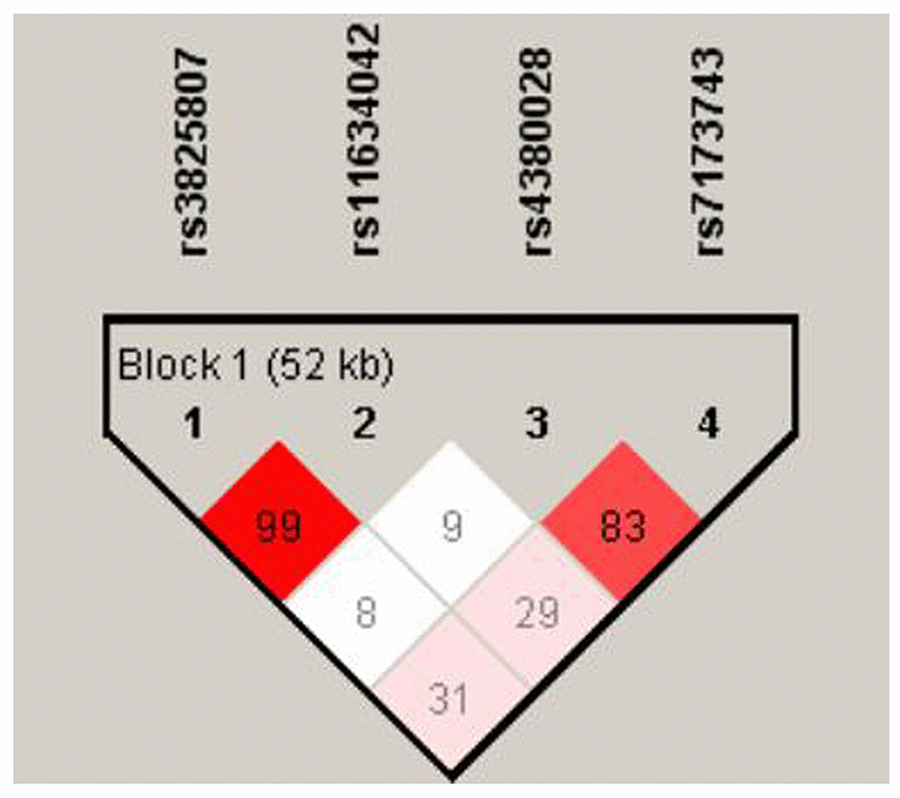
Figure 1. The linkage pattern of polymorphisms in ADAMTS7 gene. The shade of the diamonds represents the pairwise r2 between the two SNPs as defined by the top left and top right sides of the diamond. Shading represents the magnitude of the pairwise r2, with red shades reflecting high r2 (>0.80) and white shades reflecting low r2.
Haplotype analysis
The G-T-T-C and G-T-C-C haplotypes (corresponding to the rs3825807–rs11634042–rs4380028–rs7173743 variants) were significantly less frequent in IS patients than control (P = 2.0×10⁻⁶ and P = 3.6×10⁻⁴, respectively). Adjustments for age, gender, smoking, hypertension, and diabetes mellitus, showed these two haplotypes to be linked with reduced IS risk in comparison to the most common A-C-C-T haplotype after the same adjustment (Table 3).
Table 3. The frequencies of haplotypes of ADAMTS7 gene in combined cohort.
| Haplotypes | Case (freq%) | Control (freq%) | P valuea | OR (95% CI) | |||||||||||||||||||||||||||||||||||||||||||||||||||||||||||||||||||||||||||||||||||||||||||||||
| ADAMTS7 (rs3825807, rs11634042, rs4380028, rs7173743) | |||||||||||||||||||||||||||||||||||||||||||||||||||||||||||||||||||||||||||||||||||||||||||||||||||
| A-C-C-T | 1093(42.8) | 974(38.4) | 1.00(reference) | ||||||||||||||||||||||||||||||||||||||||||||||||||||||||||||||||||||||||||||||||||||||||||||||||
| A-C-T-C | 815(31.9) | 811(32.0) | 0.11 | 0.90(0.79-1.03) | |||||||||||||||||||||||||||||||||||||||||||||||||||||||||||||||||||||||||||||||||||||||||||||||
| A-C-C-C | 176(6.9) | 188(7.4) | 0.11 | 0.82(0.66-1.03) | |||||||||||||||||||||||||||||||||||||||||||||||||||||||||||||||||||||||||||||||||||||||||||||||
| G-T-T-C | 112(4.4) | 188(7.4) | 2.0×10⁻⁶ | 0.57(0.45-0.73) | |||||||||||||||||||||||||||||||||||||||||||||||||||||||||||||||||||||||||||||||||||||||||||||||
| G-T-C-C | 99(3.9) | 147(5.8) | 3.6×10⁻⁴ | 0.50(0.38-0.66) | |||||||||||||||||||||||||||||||||||||||||||||||||||||||||||||||||||||||||||||||||||||||||||||||
| Adjusted for age, gender, smoking, hypertension, diabetes mellitus and hyperlipidaemia. | |||||||||||||||||||||||||||||||||||||||||||||||||||||||||||||||||||||||||||||||||||||||||||||||||||
| All those frequency<0.05 will be ignored in analysis. | |||||||||||||||||||||||||||||||||||||||||||||||||||||||||||||||||||||||||||||||||||||||||||||||||||
| a False discovery rate-adjusted P value for multiple hypotheses testing using the Benjamini-Hochberg method. | |||||||||||||||||||||||||||||||||||||||||||||||||||||||||||||||||||||||||||||||||||||||||||||||||||
| P value under 0.05 was indicated in bold font. | |||||||||||||||||||||||||||||||||||||||||||||||||||||||||||||||||||||||||||||||||||||||||||||||||||
Association between ADAMTS7 variants and demographic characteristics
Tables 4–6 show the relationships between ADAMTS7 variants and key demographic characteristics. After stratification by age, diabetes, and hypertension, the G allele at rs3825807 and the T allele at rs11634042 were associated with lower IS risk in patients under 70 years of age (P = 0.0015 and P = 0.0012, respectively), women (P = 0.0015 and P = 0.0012, respectively), nondiabetic patients (P = 0.0015 and P = 0.0012, respectively) and non-hypertensive patients (P = 0.0015 and P = 0.0013, respectively) (Tables 4, 5). Interestingly, stratification by age, gender, diabetes, and hypertension also attributed decreased risk to the C allele at rs7173743 in patients under 70 years of age (P = 0.0016), female (P = 1.4×10⁻⁵), nondiabetic patients (P = 4.0×10⁻⁵) and non-hypertensive patients (P = 0.0034) (Table 6).
Table 4. A comparison between the baseline characteristics of the ADAMTS7 rs3825807 genotypes and alleles in combined IS patient and control groups.
| Characteristics | IS patient group | Control group | PGa value | PAa value | |||||||||||||||||||||||||||||||||||||||||||||||||||||||||||||||||||||||||||||||||||||||||||||||
| Genotype n (%) | Allele n (%) | Genotype n (%) | Allele n (%) | ||||||||||||||||||||||||||||||||||||||||||||||||||||||||||||||||||||||||||||||||||||||||||||||||
| AA | AG | GG | A | G | AA | AG | GG | A | G | ||||||||||||||||||||||||||||||||||||||||||||||||||||||||||||||||||||||||||||||||||||||||||
| Age | |||||||||||||||||||||||||||||||||||||||||||||||||||||||||||||||||||||||||||||||||||||||||||||||||||
| ≥70 | 389(75.4) | 117(22.7) | 10(1.9) | 895(86.7) | 137(13.3) | 265(69.6) | 104(27.3) | 12(3.1) | 634(83.2) | 128(16.8) | 0.15 | 0.057 | |||||||||||||||||||||||||||||||||||||||||||||||||||||||||||||||||||||||||||||||||||||||
| <70 | 565(75.0) | 181(22.8) | 17(2.2) | 1311(85.9) | 215(14.1) | 590(66.5) | 264(29.8) | 33(3.7) | 1444(81.4) | 330(18.6) | 0.0067 | 0.0015 | |||||||||||||||||||||||||||||||||||||||||||||||||||||||||||||||||||||||||||||||||||||||
| Gender | |||||||||||||||||||||||||||||||||||||||||||||||||||||||||||||||||||||||||||||||||||||||||||||||||||
| Male | 635(74.8) | 199(23.4) | 15(1.8) | 1469(86.5) | 229(13.5) | 500(70.0) | 198(27.7) | 16(2.3) | 1198(83.9) | 230 (16.1) | 0.15 | 0.057 | |||||||||||||||||||||||||||||||||||||||||||||||||||||||||||||||||||||||||||||||||||||||
| Female | 319(74.2) | 99(23.0) | 12(2.8) | 737(85.7) | 123(14.3) | 355(64.1) | 170(30.7) | 29(5.2) | 880(79.4) | 228(20.6) | 0.022 | 0.0015 | |||||||||||||||||||||||||||||||||||||||||||||||||||||||||||||||||||||||||||||||||||||||
| Diabetes | |||||||||||||||||||||||||||||||||||||||||||||||||||||||||||||||||||||||||||||||||||||||||||||||||||
| Yes | 284(78.2) | 71(19.6) | 8(2.2) | 639(88.0) | 87(12.0) | 82(73.9) | 28(25.2) | 1(0.9) | 192(86.5) | 30(13.5) | 0.37 | 0.56 | |||||||||||||||||||||||||||||||||||||||||||||||||||||||||||||||||||||||||||||||||||||||
| No | 670(73.1) | 227(24.8) | 19(2.1) | 1567(85.5) | 265(14.5) | 773(66.8) | 340(29.4) | 44(3.8) | 1886(81.5) | 428(18.5) | 0.0067 | 0.0015 | |||||||||||||||||||||||||||||||||||||||||||||||||||||||||||||||||||||||||||||||||||||||
| Hypertension | |||||||||||||||||||||||||||||||||||||||||||||||||||||||||||||||||||||||||||||||||||||||||||||||||||
| Yes | 662(74.3) | 209(23.5) | 20(2.2) | 1533(86.0) | 249(14.0) | 247(70.0) | 95(26.9) | 11(3.1) | 589(83.4) | 117(16.6) | 0.29 | 0.11 | |||||||||||||||||||||||||||||||||||||||||||||||||||||||||||||||||||||||||||||||||||||||
| No | 292(75.3) | 89(22.9) | 7(1.8) | 673(86.7) | 103(13.3) | 608(66.5) | 273(29.8) | 34(3.7) | 1489(81.4) | 341(18.6) | 0.010 | 0.0015 | |||||||||||||||||||||||||||||||||||||||||||||||||||||||||||||||||||||||||||||||||||||||
| PG: P value of the difference in alleles between the case and control groups; PA: P value of the difference in genotype between the case and control groups | |||||||||||||||||||||||||||||||||||||||||||||||||||||||||||||||||||||||||||||||||||||||||||||||||||
| a adjusted for age, gender, smoking, hypertension, diabetes mellitus and hyperlipidaemia. | |||||||||||||||||||||||||||||||||||||||||||||||||||||||||||||||||||||||||||||||||||||||||||||||||||
| P < 0.05 is indicated in bold font. | |||||||||||||||||||||||||||||||||||||||||||||||||||||||||||||||||||||||||||||||||||||||||||||||||||
Table 5. A comparison between the baseline characteristics of the ADAMTS7 rs11634042 genotypes and alleles in combined IS patient and control groups.
| Characteristics | IS patient group | Control group | PGa value | PAa value | |||||||||||||||||||||||||||||||||||||||||||||||||||||||||||||||||||||||||||||||||||||||||||||||
| Genotype n (%) | Allele n (%) | Genotype n (%) | Allele n (%) | ||||||||||||||||||||||||||||||||||||||||||||||||||||||||||||||||||||||||||||||||||||||||||||||||
| CC | CT | TT | C | T | CC | CT | TT | C | T | ||||||||||||||||||||||||||||||||||||||||||||||||||||||||||||||||||||||||||||||||||||||||||
| Age | |||||||||||||||||||||||||||||||||||||||||||||||||||||||||||||||||||||||||||||||||||||||||||||||||||
| ≥70 | 391(75.8) | 115(22.3) | 10(1.9) | 897(86.9) | 135(13.1) | 265(69.9) | 102(26.9) | 12(3.2) | 632(83.4) | 126(16.6) | 0.15 | 0.067 | |||||||||||||||||||||||||||||||||||||||||||||||||||||||||||||||||||||||||||||||||||||||
| <70 | 569(74.6) | 179(23.5) | 15(2.0) | 1317(86.3) | 209(13.7) | 598(67.3) | 258(29.0) | 33(3.7) | 1454(81.8) | 324(18.2) | 0.0080 | 0.0012 | |||||||||||||||||||||||||||||||||||||||||||||||||||||||||||||||||||||||||||||||||||||||
| Gender | |||||||||||||||||||||||||||||||||||||||||||||||||||||||||||||||||||||||||||||||||||||||||||||||||||
| Male | 636(75.0) | 198(23.2) | 15(1.8) | 1470(86.6) | 228(13.4) | 503(69.9) | 196(28.0) | 15(2.1) | 1202(83.9) | 226(16.1) | 0.16 | 0.069 | |||||||||||||||||||||||||||||||||||||||||||||||||||||||||||||||||||||||||||||||||||||||
| Female | 324(75.1) | 96(22.6) | 10(2.3) | 744(86.4) | 116(13.6) | 360(65.7) | 164(28.9) | 30(5.4) | 887(80.1) | 221(19.9) | 0.014 | 0.0012 | |||||||||||||||||||||||||||||||||||||||||||||||||||||||||||||||||||||||||||||||||||||||
| Diabetes | |||||||||||||||||||||||||||||||||||||||||||||||||||||||||||||||||||||||||||||||||||||||||||||||||||
| Yes | 286(78.8) | 72(19.8) | 5(1.4) | 644(88.7) | 82(11.3) | 84(75.7) | 26(23.4) | 1(0.9) | 194(87.4) | 28(12.6) | 0.70 | 0.63 | |||||||||||||||||||||||||||||||||||||||||||||||||||||||||||||||||||||||||||||||||||||||
| No | 674(73.6) | 222(24.2) | 20(2.2) | 1570(85.7) | 262(14.3) | 773(66.8) | 340(29.4) | 44(3.8) | 1886(81.5) | 428(18.5) | 0.0080 | 0.0012 | |||||||||||||||||||||||||||||||||||||||||||||||||||||||||||||||||||||||||||||||||||||||
| Hypertension | |||||||||||||||||||||||||||||||||||||||||||||||||||||||||||||||||||||||||||||||||||||||||||||||||||
| Yes | 666(74.8) | 205(23.0) | 20(2.2) | 1537(86.3) | 245(13.7) | 247(70.1) | 91(25.9) | 14(4.0) | 585(83.1) | 119(16.9) | 0.15 | 0.068 | |||||||||||||||||||||||||||||||||||||||||||||||||||||||||||||||||||||||||||||||||||||||
| No | 294(75.8) | 89(22.9) | 5(1.3) | 677(87.2) | 99(12.8) | 616(67.2) | 269(29.4) | 31(3.4) | 1495(81.9) | 331(18.1) | 0.0080 | 0.0013 | |||||||||||||||||||||||||||||||||||||||||||||||||||||||||||||||||||||||||||||||||||||||
| PG: P value of the difference in alleles between the case and control groups; PA: P value of the difference in genotype between the case and control groups | |||||||||||||||||||||||||||||||||||||||||||||||||||||||||||||||||||||||||||||||||||||||||||||||||||
| a adjusted for age, gender, smoking, hypertension, diabetes mellitus and hyperlipidaemia. | |||||||||||||||||||||||||||||||||||||||||||||||||||||||||||||||||||||||||||||||||||||||||||||||||||
| P < 0.05 is indicated in bold font. | |||||||||||||||||||||||||||||||||||||||||||||||||||||||||||||||||||||||||||||||||||||||||||||||||||
Table 6. A comparison between the baseline characteristics of the ADAMTS7 rs7173743 genotypes and alleles in combined IS patient and control groups.
| Characteristics | IS patient group | Control group | PGa value | PAa value | |||||||||||||||||||||||||||||||||||||||||||||||||||||||||||||||||||||||||||||||||||||||||||||||
| Genotype n (%) | Allele n (%) | Genotype n (%) | Allele n (%) | ||||||||||||||||||||||||||||||||||||||||||||||||||||||||||||||||||||||||||||||||||||||||||||||||
| TT | TC | CC | T | C | TT | TC | CC | T | C | ||||||||||||||||||||||||||||||||||||||||||||||||||||||||||||||||||||||||||||||||||||||||||
| Age | |||||||||||||||||||||||||||||||||||||||||||||||||||||||||||||||||||||||||||||||||||||||||||||||||||
| ≥70 | 169(32.8) | 226(43.8) | 121(23.4) | 564(54.7) | 468(45.3) | 101(26.5) | 185(48.6) | 95(24.9) | 387(50.8) | 375(49.2) | 0.17 | 0.15 | |||||||||||||||||||||||||||||||||||||||||||||||||||||||||||||||||||||||||||||||||||||||
| <70 | 183(24.0) | 413(54.1) | 167(21.9) | 779(51.0) | 747(49.0) | 186(21.0) | 427(48.1) | 274(30.9) | 799(45.0) | 975(55.0) | 5.1×10⁻⁴ | 0.0016 | |||||||||||||||||||||||||||||||||||||||||||||||||||||||||||||||||||||||||||||||||||||||
| Gender | |||||||||||||||||||||||||||||||||||||||||||||||||||||||||||||||||||||||||||||||||||||||||||||||||||
| Male | 243(28.6) | 410(48.3) | 196(23.1) | 896(52.8) | 802(47.2) | 179(25.1) | 341(47.8) | 194(27.1) | 699(48.9) | 729(51.1) | 0.17 | 0.054 | |||||||||||||||||||||||||||||||||||||||||||||||||||||||||||||||||||||||||||||||||||||||
| Female | 133(30.9) | 206(47.9) | 91(21.2) | 472(54.9) | 388(45.1) | 108(19.5) | 271(48.9) | 175(31.6) | 487(44.0) | 621(56.0) | 8.8×10⁻⁵ | 1.4×10⁻⁵ | |||||||||||||||||||||||||||||||||||||||||||||||||||||||||||||||||||||||||||||||||||||||
| Diabetes | |||||||||||||||||||||||||||||||||||||||||||||||||||||||||||||||||||||||||||||||||||||||||||||||||||
| Yes | 85(23.4) | 192(52.9) | 86(23.7) | 362(49.9) | 364(50.1) | 28(25.3) | 51(45.9) | 32(28.8) | 107(48.2) | 115(51.8) | 0.40 | 0.70 | |||||||||||||||||||||||||||||||||||||||||||||||||||||||||||||||||||||||||||||||||||||||
| No | 267(29.1) | 447(48.8) | 202(22.1) | 981(53.5) | 851(46.5) | 259(22.4) | 561(48.5) | 337(29.1) | 1079(46.6) | 1235(53.4) | 2.8×10⁻⁴ | 4.0×10⁻⁵ | |||||||||||||||||||||||||||||||||||||||||||||||||||||||||||||||||||||||||||||||||||||||
| Hypertension | |||||||||||||||||||||||||||||||||||||||||||||||||||||||||||||||||||||||||||||||||||||||||||||||||||
| Yes | 246(27.6) | 443(49.7) | 202(22.7) | 935(52.5) | 847(47.5) | 85(24.2) | 177(50.0) | 91(25.8) | 347(49.2) | 359(50.8) | 0.38 | 0.16 | |||||||||||||||||||||||||||||||||||||||||||||||||||||||||||||||||||||||||||||||||||||||
| No | 106(27.3) | 196(50.5) | 86(22.2) | 408(52.6) | 368(47.4) | 202(22.1) | 435(47.5) | 278(30.4) | 839(45.8) | 991(54.2) | 0.011 | 0.0034 | |||||||||||||||||||||||||||||||||||||||||||||||||||||||||||||||||||||||||||||||||||||||
| PG: P value of the difference in alleles between the case and control groups; PA: P value of the difference in genotype between the case and control groups | |||||||||||||||||||||||||||||||||||||||||||||||||||||||||||||||||||||||||||||||||||||||||||||||||||
| a adjusted for age, gender, smoking, hypertension, diabetes mellitus and hyperlipidaemia. | |||||||||||||||||||||||||||||||||||||||||||||||||||||||||||||||||||||||||||||||||||||||||||||||||||
| P < 0.05 is indicated in bold font. | |||||||||||||||||||||||||||||||||||||||||||||||||||||||||||||||||||||||||||||||||||||||||||||||||||
Association of ADAMTS7 variants with stroke subtypes
Patients with IS enrolled in our study were subcategorized according to the Trial of Org 10172 in Acute Stroke Treatment (TOAST) classification t to elucidate if ADAMTS7 variants increased overall risk or were limited to a higher risk of specific stroke subtypes. Stratification by the TOAST classification revealed that, compared to controls, carriers of the rs3825807 G allele (P = 6.0×10⁻⁴), the rs11634042 T allele (P = 4.4×10⁻⁴), or the rs7173743 C allele (P = 5.2×10⁻⁴) had reduced risk of large-artery atherosclerosis (LAA)-subtype stroke (Tables 7–9).
Table 7. The relationship between ADAMTS7 rs3825807 variant and IS stratified by TOAST classification in combined IS patients.
| ADAMTS7 rs3825807 | |||||||||||||||||||||||||||||||||||||||||||||||||||||||||||||||||||||||||||||||||||||||||||||||||||
| Genotype | P valuea | Allele | P valuea | OR (95% CI) | |||||||||||||||||||||||||||||||||||||||||||||||||||||||||||||||||||||||||||||||||||||||||||||||
| AA | AG | GG | A | G | |||||||||||||||||||||||||||||||||||||||||||||||||||||||||||||||||||||||||||||||||||||||||||||||
| Control (n=1268) | 855(67.4) | 368(29.0) | 45(3.6) | 2078(81.9) | 458(18.1) | ||||||||||||||||||||||||||||||||||||||||||||||||||||||||||||||||||||||||||||||||||||||||||||||
| Cases | |||||||||||||||||||||||||||||||||||||||||||||||||||||||||||||||||||||||||||||||||||||||||||||||||||
| LAA (n=812) | 607(74.8) | 189(23.3) | 16(2.0) | 0.0033 | 1403(86.4) | 221(13.6) | 6.0×10⁻⁴ | 0.72(0.60-0.85) | |||||||||||||||||||||||||||||||||||||||||||||||||||||||||||||||||||||||||||||||||||||||||||
| SAA (n=355) | 258(72.7) | 88 (24.8) | 9(2.5) | 0.23 | 604 (85.1) | 106(14.9) | 0.069 | 0.80(0.63- 1.00) | |||||||||||||||||||||||||||||||||||||||||||||||||||||||||||||||||||||||||||||||||||||||||||
| CE (n=46) | 36(78.3) | 9(19.6) | 1(2.2) | 0.32 | 81(88.0) | 11(12.0) | 0.13 | 0.62(0.33- 1.17) | |||||||||||||||||||||||||||||||||||||||||||||||||||||||||||||||||||||||||||||||||||||||||||
| UE (n=66) | 53(80.3) | 12(18.2) | 1(1.5) | 0.19 | 118(89.4) | 14(10.6) | 0.058 | 0.54(0.31-0.95) | |||||||||||||||||||||||||||||||||||||||||||||||||||||||||||||||||||||||||||||||||||||||||||
| LAA: Large-artery atherosclerosis; SAA: Small-artery atherosclerosis; CE: Cardioembolic; UE: Undetermined aetiology. | |||||||||||||||||||||||||||||||||||||||||||||||||||||||||||||||||||||||||||||||||||||||||||||||||||
Table 8. The relationship between ADAMTS7 rs11634042 variant and IS stratified by TOAST classification in combined IS patients.
| ADAMTS7 rs11634042 | |||||||||||||||||||||||||||||||||||||||||||||||||||||||||||||||||||||||||||||||||||||||||||||||||||
| Genotype | P valuea | Allele | P valuea | OR (95% CI) | |||||||||||||||||||||||||||||||||||||||||||||||||||||||||||||||||||||||||||||||||||||||||||||||
| CC | CT | TT | C | T | |||||||||||||||||||||||||||||||||||||||||||||||||||||||||||||||||||||||||||||||||||||||||||||||
| Control (n=1268) | 863 (68.0) | 360 (28.4) | 45(3.6) | 2086(82.3) | 450(17.7) | ||||||||||||||||||||||||||||||||||||||||||||||||||||||||||||||||||||||||||||||||||||||||||||||
| Cases | |||||||||||||||||||||||||||||||||||||||||||||||||||||||||||||||||||||||||||||||||||||||||||||||||||
| LAA (n=812) | 613(75.5) | 183(22.5) | 16(2.0) | 0.0026 | 1409(86.8) | 215(13.2) | 4.4×10⁻⁴ | 0.71(0.59-0.84) | |||||||||||||||||||||||||||||||||||||||||||||||||||||||||||||||||||||||||||||||||||||||||||
| SAA (n=355) | 259(73.0) | 89(25.0) | 7(2.0) | 0.17 | 607(85.5) | 103(14.5) | 0.057 | 0.79(0.62-0.99) | |||||||||||||||||||||||||||||||||||||||||||||||||||||||||||||||||||||||||||||||||||||||||||
| CE (n=46) | 35(76.1) | 10(21.7) | 1(2.2) | 0.64 | 80(87.0) | 12(13.0) | 0.25 | 0.70(0.38 - 1.29) | |||||||||||||||||||||||||||||||||||||||||||||||||||||||||||||||||||||||||||||||||||||||||||
| UE (n=66) | 53(80.3) | 12(18.2) | 1(1.5) | 0.17 | 118(89.4) | 14(10.6) | 0.057 | 0.55(0.31 -0.97) | |||||||||||||||||||||||||||||||||||||||||||||||||||||||||||||||||||||||||||||||||||||||||||
| LAA: Large-artery atherosclerosis; SAA: Small-artery atherosclerosis; CE: Cardioembolic; UE: Undetermined aetiology. | |||||||||||||||||||||||||||||||||||||||||||||||||||||||||||||||||||||||||||||||||||||||||||||||||||
Table 9. The relationship between ADAMTS7 rs7173743 variant and IS stratified by TOAST classification in combined IS patients.
| ADAMTS7 rs7173743 | |||||||||||||||||||||||||||||||||||||||||||||||||||||||||||||||||||||||||||||||||||||||||||||||||||
| Genotype | P valuea | Allele | P valuea | OR (95% CI) | |||||||||||||||||||||||||||||||||||||||||||||||||||||||||||||||||||||||||||||||||||||||||||||||
| TT | TC | CC | T | C | |||||||||||||||||||||||||||||||||||||||||||||||||||||||||||||||||||||||||||||||||||||||||||||||
| Control (n=1268) | 287 (22.6) | 612 (48.3) | 369 (29.1) | 1186(46.8) | 1350(53.2) | ||||||||||||||||||||||||||||||||||||||||||||||||||||||||||||||||||||||||||||||||||||||||||||||
| Cases | |||||||||||||||||||||||||||||||||||||||||||||||||||||||||||||||||||||||||||||||||||||||||||||||||||
| LAA (n=812) | 224(27.6) | 410(50.5) | 178(21.9) | 0.0019 | 858(52.8) | 766(47.2) | 5.2×10⁻⁴ | 0.78(0.69 -0.89) | |||||||||||||||||||||||||||||||||||||||||||||||||||||||||||||||||||||||||||||||||||||||||||
| SAA (n=355) | 94(26.5) | 174(49.0) | 87(24.5) | 0.19 | 362 (51.0) | 348(49.0) | 0.063 | 0.84(0.72- 1.00) | |||||||||||||||||||||||||||||||||||||||||||||||||||||||||||||||||||||||||||||||||||||||||||
| CE (n=46) | 14(30.4) | 25(54.3) | 7 (15.3) | 0.18 | 53(57.6) | 39(42.4) | 0.063 | 0.65(0.42- 0.98) | |||||||||||||||||||||||||||||||||||||||||||||||||||||||||||||||||||||||||||||||||||||||||||
| UE (n=66) | 20(30.3) | 30(45.5) | 16 (24.2) | 0.34 | 70(53.0) | 62(47.0) | 0.16 | 0.78(0.55- 1.10) | |||||||||||||||||||||||||||||||||||||||||||||||||||||||||||||||||||||||||||||||||||||||||||
| LAA: Large-artery atherosclerosis; SAA: Small-artery atherosclerosis; CE: Cardioembolic; UE: Undetermined aetiology. | |||||||||||||||||||||||||||||||||||||||||||||||||||||||||||||||||||||||||||||||||||||||||||||||||||
Effect of ADAMTS7 variants on ADAMTS7 expression
ADAMTS7 mRNA expression levels in PBMCs from 87 patients with IS and 70 healthy controls were measured and compared, without significant differences; P = 0.63 (Figure 2A). We also investigated the link between mean ADAMTS7 mRNA levels in IS patients and the ADAMTS7 genotype (Figure 2). Significantly reduced ADAMTS7 mRNA expression was found in IS patients carrying the mutated rs3825807 G allele (P = 0.025; Figure 2B) or the rs11634042 T allele (P = 0.045; Figure 2C). Nevertheless, no such difference was found between carriers of the rs4380028 and rs7173743 alleles and carriers of the major common alleles regarding ADAMTS7 mRNA expression, in either IS patients or control (Figure 2D and 2E).
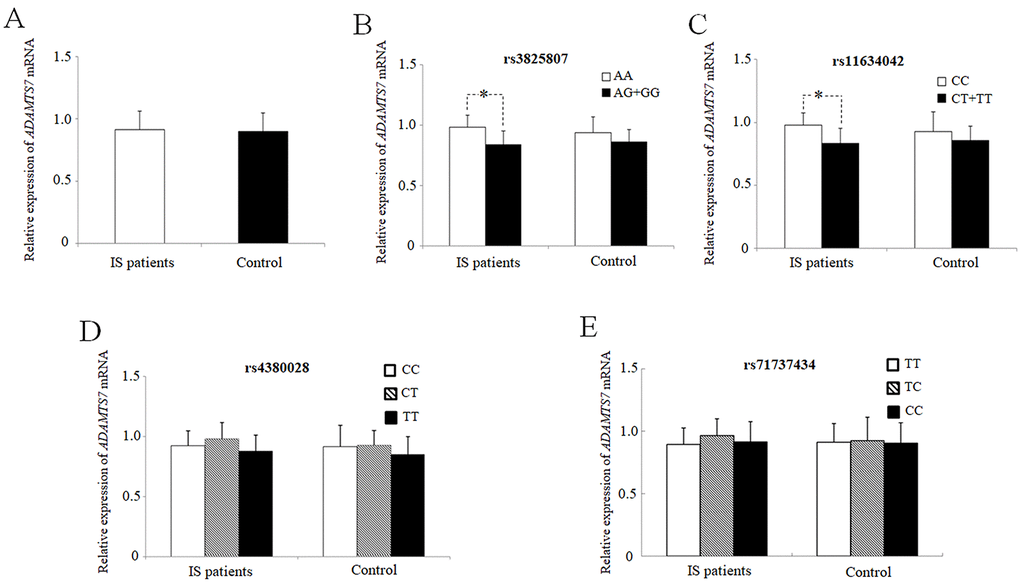
Figure 2. Mean values ± SD of relative ADAMTS7 mRNA in PBMCs from IS patients (IS, n = 87) and healthy subjects (controls, n = 50). the blank box and the black box represent the relative expressions of adamts7 in IS patients and controls, respectively, and the median is indicated by a bar across the box. p=0.63 when comparing relative adamts7 mRNA levels between IS patients and controls. mean values ± sd of adamts7 mRNA in pbmcs from IS patients and healthy subjects stratified according to the genotypes and alleles of rs3825807 (B) (*p = 0.025), rs11634042 (C) (*p = 0.045), rs4380028 (D) and rs7173743 (E), respectively. an asterisk indicates p < 0.05.
Effect of ADAMTS7 variants on carotid atherosclerosis
The mean CIMT of the IS patients with the mutated genotypes (rs3825807 GA&AA, rs11634042 CT&TT, rs4380028 CT&TT and rs7173743 CT&TT) and IS patients with the major genotypes (rs3825807AA, rs11634042CC, rs4380028CC andrs7173743TT) was similar, without significant differences; P>0.05 (Figure 3).
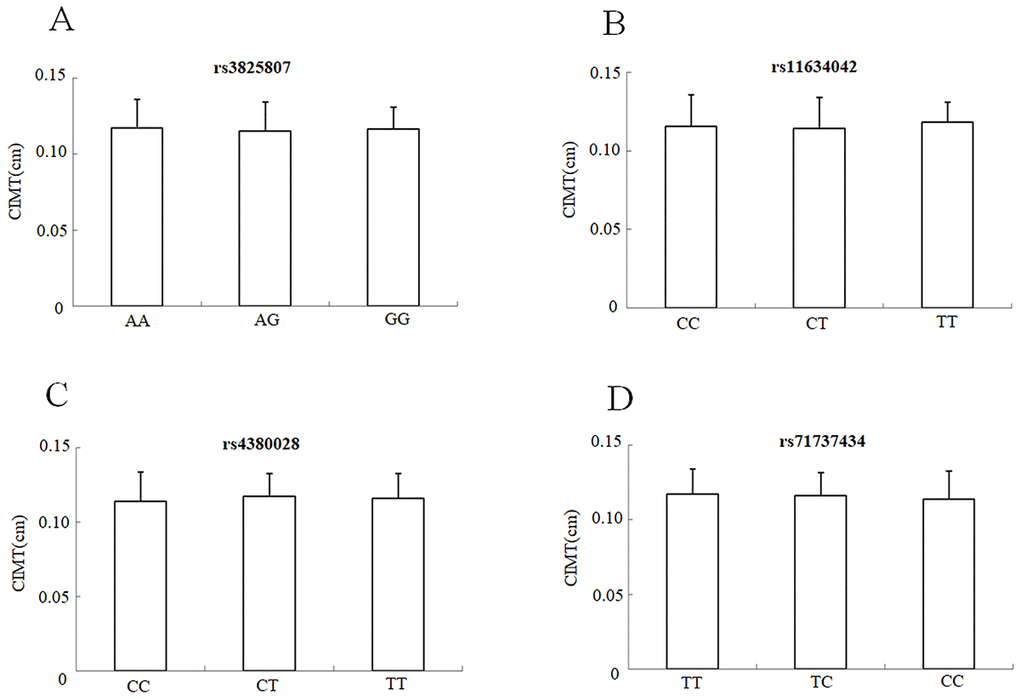
Figure 3. CIMT mean values ± SD of IS patients (n = 264) stratified according to the genotypes and alleles of rs3825807. (A), rs11634042 (B), rs4380028 (C) and rs7173743 (D), respectively.
Discussion
Our main finding is that we first demonstrate the rs3825807, rs11634042, and rs7173743 ADAMTS7 variants to be associated with low IS risk. Assessment of the haplotypes indicated the G-T-T-C and G-T-C-C haplotypes (the rs3825807–rs11634042–rs4380028–rs7173743 variants) were associated with reduced IS risk. Furthermore, the rs3825807 G, rs11634042 T, and rs7173743 C alleles were also linked with a lower risk of LAA-subtype stroke after stratification analysis. In addition, the rs3825807 and rs11634042 variants appeared to modulate ADAMTS7 expression.
Research has increasingly supported the role of ADAMTS7 as a promoter of neointimal proliferation, plaque development, and plaque calcification, as the underlying pathology for vast majority of IS patients. Overexpression of ADAMTS7 through adenoviral infection enhanced VSMC proliferation and mobility in vitro and increased neointimal formation in rats. In contrast, ADAMTS7 downregulation mediated by small interfering RNA (siRNA) had the opposite effect [7]. In human coronary and carotid atherosclerotic plaques, ADAMTS7 is most prominent in the proximity of the intima-media border and the fibrous cap [15]. The ADAMTS7 rs3825807 G allele has been noted to affect ADAMTS7 maturation, while COMP cleavage and VSMC migration has been linked with subclinical atherosclerosis. ADAMTS7 upregulation mediated by miR-29a/b repression facilitates vascular calcification both in vitro and in vivo [18]. Although ADAMTS7 is widely recognized to intervene in the pathophysiology of atherosclerosis, the ADAMTS7 alleles specifically related to IS have yet to be elucidated.
Various ADAMTS7 SNPs have been linked with CAD in isolated GWA studies [11–13]. To date, rs3825807 is the most widely studied functional SNP in this group and has been reported to suppress ADAMTS7 maturation, COMP cleavage, and VSMC migration [15]. Likewise, the ADAMTS7 rs3825807 GG genotype appears to have an inverse correlation with atherosclerosis, reflected in lower frequency and magnitude of carotid atherosclerosis [15]. Also, in patients with CAD, the mutant G allele of the ADAMTS7 rs3825807 variant appears to improve cardiovascular survival [16]; as well as reduced severity of the CAD phenotype [17]. In a Chinese cohort, You et al. found ADAMTS7 rs3825807 is related to CAD risk and severity [19]. This study is the first to demonstrate lower IS risk in subjects with the mutant alleles at the rs3825807, rs11634042and rs7173743 locus of ADAMTS7, as well as the G–T–T–C and G-T-C-C haplotypes, which corresponds to the rs3825807–rs11634042–rs4380028–rs7173743 variants.
Our findings suggested the variant G allele of ADAMTS7 rs3825807 may protect against stroke, in harmony with GWA studies which have linked the G allele of with lower CAD risk. Our study also reported for the first time that the rs7173743 variant was associated with decreased risk of IS; this result is in agreement with the findings associating this variant with coronary artery calcium contents in Hispanics [20]. Although GWA studies have also identified ADAMTS7 rs4380028 as a novel susceptibility locus for CAD, a case-control study of the Japanese population failed to replicate the association between this variant and coronary atherosclerosis [21]. Consistent with this report, we did not find any significant associations between the ADAMTS7 rs4380028 variant and IS. Nevertheless, further studies are needed to fully explain the associations between this gene and the incidence of IS in different populations.
The rs3825807 G/G genotype in the ADAMTS7 locus, has been linked with reduced prevalence and severity of atherosclerosis, yet does not appear to reduce the expression of ADAMTS7 but its maturation and activity, resulting in reduced COMP cleavage and attenuated VSMC migration [15]. Another recent study by Bayoglu et al. demonstrated greater ADAMTS7 expression in patients with peripheral artery disease and the AA genotype of rs3825807 [22]. In our present study, ADAMTS7 expression was diminished in IS patients with the G allele of rs3825807 and the T allele of rs11634042. The rs3825807 Ser214Pro variant may impact ADAMTS7 expression due to the change of a polar amino acid (serine) for a non-polar one (proline) in the protein’s prodomain. This assumption is also supported by reports associating the protective T allele of ADAMTS7 rs7178051—which is modestly linked to disequilibrium with rs3825807 (LD=0.52)—with lower ADAMTS7 expression in human aortic endothelial cells and lymphoblastoid cells [23]. Unexpectedly, our study found ADAMTS7 expression to be similar in both IS patients and controls. We speculate that this lack of a difference is not because ADAMTS7 role in IS, rather, it is likely compromised by other unknown factors, such as other genetic variants of ADAMTS7 or interactions with other environmental factors.
Because dysregulated degradation of the ECM in vascular walls is a central phenomenon in the pathophysiology of atherosclerosis in carotid arteries, ADAMTS7 might be implicated in the early stages of vascular remodelling, thus promoting thickening of the CIMT. However, Hispanics enrolled in the MESA (Multi-Ethnic Study of Atherosclerosis) cohort, were found to have various ADAMTS7 SNPs related to coronary artery calcification, without impact on CIMT [20]. Similarly, a very recent study performed by Chan et al. found no link between whole intima or media thickness with the G allele of the ADAMTS7 rs3825807 variant [17]. Consistent with these reports, we also found no association between ADAMTS7 variants and CIMT in IS patients, thus offering limited support to the notion ADAMTS7 variants are direct risk factors for CIMT, which is most prominently in earlier disease stages. The lack of association appears to stand despite the implications of ADAMTS7 in vascular remodelling and thickening, as well as atherosclerotic plaque development. Further studies with broader samples should re-examine the effect of ADAMTS7 variants on CIMT.
Given the limitations, caution is advised when interpreting results from this study. First, ADAMTS7 levels were compared with the genotypes only in a small number of patients and controls (87 IS patients vs. 70 healthy controls), which may have caused a type II error. Second, information, selection, and confounding bias cannot be excluded with total certainty. Controls were judged as IS-free solely through their medical history, without confirmation with neuroimaging. The lack of imaging in the control group may implicate a confounder by the inclusion of controls with a history of silent stroke, thereby altering statistical analyses. Other confounding variables include risk factors such as age, gender, and the presence of comorbidities. Third, additional functional variants may also modulate ADAMTS7 expression and intervene in IS. These combined effects require further exploration to enhance the prediction of IS. Meanwhile, modulating these factors decrease the occurrence, severity, and outcomes of IS patients. Fourth, circulating COMP levels were not examined, meaning the impact of ADAMTS7 variants on COMP expression in IS patients also went unassessed. Indeed, before drawing definitive conclusions from our findings, further confirmation is necessary for large independent samples, including subjects with varying ethnicities. This would highlight their usefulness for estimating IS risk in different individuals.
This study is the first to show the ADAMTS7 rs3825807, rs11634042 and rs7173743 variants confer a lower risk of IS. Furthermore, the ADAMTS7 rs3825807 and rs11634042 variants may modulate the genetic predisposition to IS by reducing ADAMTS7 expression. This new piece of knowledge regarding ADAMTS7 may be clinically significant for the prevention and personalized therapy of IS.
Materials and Methods
Subject recruitment and sample collection
This two-stage case-control study recruited 1279 IS patients and 1268 controls. The initial cohort comprises 615 individuals with IS (408 men, 207 women) recruited by the Department of Neurology at the Affiliated Hospital of Guangdong Medical University between 2015 and 2017. To confirm the significant statistics observed in the initial cohort, a replication cohort included 664 IS patients and 653 healthy individuals were consecutively recruited from the First Affiliated Hospital of Harbin Medical University from 2015 to 2018. All human subjects in initial cohort and replication cohort were genetically unrelated Han Chinese adults from Guangdong and Heilongjiang Province. The diagnosis of IS was established by the assessment of clinical symptoms and physical examination; as well as neuroimaging. Patients were categorized using the TOAST system [24]. On the other hand, we excluded subjects with previously established transient ischaemic attacks, coronary artery disease, haemorrhagic stroke, subarachnoid hemorrhage, chronic infections, cancer, and hematologic, immunologic and systemic inflammatory disorders. We also excluded one patient who had previously suffered an IS.
The initial control group included 615 age-matched and ethnicity-matched subjects (311 men, 304 women) who consulted at the Health Examination Center of the Affiliated Hospital of Guangdong Medical University in parallel to the IS patients regarding time. The replication control subjects randomly selected 653 sex- and age-matched healthy individuals (403 men, 250 women) from the same geographical area (Central Harbin) within the same period. The control subjects with recent myocardial infarction or cerebrovascular disease were excluded. The replication cohort followed the same inclusion and exclusion criteria as the initial one.
All subjects provided written, informed consent. All procedures in this study comply with the stipulations of the Declaration of Helsinki. Likewise, the Ethics Committee of the Affiliated Hospital of Guangdong Medical University and the First Affiliated Hospital of Harbin Medical University approved all protocols.
SNP selection and genotyping
The four ADAMTS7 SNPs (rs3825807, rs11634042, rs4380028, rs7173743) were chosen with guidance from prior research [12, 20, 21, 25]. Circulating leukocytes from each subject were processed with a TIANamp Blood DNA kit (Tiangen Biotech, Beijing, China) according to the manufacturer’s instructions for the extraction of genomic DNA. DNA purity and concentration were evaluated with a DNA spectrophotometer (ND-1000, NanoDrop, Wilmington USA). The SNaPshot Multiplex Kit (Applied Biosystems Co., Ltd., Foster City, CA, USA) was implemented for genotyping the ADAMTS7 SNPs, utilizing the primers shown in Supplementary Table 1 proceeding as described in a previous publication [26].
Extraction of the RNA and Real-Time PCR
LymphoprepTM (Axis-Shield PoCAS, Oslo, Norway) was used for isolation of peripheral blood mononuclear cells (PBMC) via centrifugation with a density gradient, as described in a previous report by our group [26]. The RNAprep pure Blood Kit (TianGen Biotech, Beijing, China) was used following the manufacturer’s indications to obtain total cellular RNA from the PBMC. The silica membrane was subjected to digestion with RNase-free DNase I to mediate the removal of genomic DNA residues. The cDNA Synthesis Kit RevertAid (Thermo) was used as per the manufacturer’s instructions to convert total RNA to cDNA. The cDNA obtained (10 ng) were used as a template to determine the quantity of ADAMTS7 and GAPDH with quantitative real-time PCR, implementing the SYBR green method as previously described [26]. ADAMTS7 and GAPDH mRNA was quantified in three independent measures. Then, the relative mRNA levels were estimated with the 2-ΔΔCt method [27] and normalized by the housekeeping gene glyceraldehyde-3-phosphate dehydrogenase (GAPDH). This method directly uses the threshold cycles generated by the qPCR system, rendering it particularly convenient and efficient for the assessment of the relative expression of both target and control genes among different samples. The following RT-PCR primers were used in the assay: ADAMTS7 sense primer, GGTCGGTCAGCAAAGAGAAG; ADAMTS7 anti-sense primer, CCATGTTCATGATGGTCAGC; GAPDH sense primer, GAAGGGCTCATGACCACAGTCCAT; and GAPDH anti-sense primer, TCATTGTCGTACCAGGAAATGAGCTT. Relative expression was calculated in each sample based on technical triplicate results. Products from amplification were validated via melting curve analysis.
Ultrasound assessment
A 7.5- to 10.0-MHz linear array ultrasonographic transducer (P700SE; Phillips Medical System) was implemented in the B-mode for assessing carotid intima-media thickness (CIMT) in both the right and left arteries, and in the near and far walls. Optimized images depicting CIMT in both the left and right arteries were chosen and paused at the end of the diastole. Maximum CIMT-i and CIMT-c were calculated by averaging the maximum values of the near and far walls in both the right and left sides, in an area free of atherosclerotic plaque, as previously described [26].
Statistical evaluation
SPSS v19.0 (IBM, Armonk, NY, USA) and GraphPad Prism v4.0 (GraphPad Software, Inc., San Diego, CA, USA) were utilized for statistical analyses. The Hardy–Weinberg equilibrium (HWE) of the SNPs was evaluated with specialized software for this purpose. Haplotype examination was performed with the Haploview v4.2. Continuous data are displayed as means ± standard deviation (SD), and the median or percentage for categorical variables. Comparisons among groups were conducted with the Chi-squared (χ2) test and Student’s t-test. Data with normal distribution were assessed with Student’s t-test; the Mann-Whitney U test was used otherwise. Fisher’s exact test or the χ2 test were implemented for comparing the frequencies of the ADAMTS7 allele and specific genotypes between patients with IS and controls. Correlations between ADAMTS7 genotypes and IS were analyzed via generation of odds ratios (OR) with 95% confidence intervals (CI). Multiple linear regression analysis of the associations between ADAMTS7 variants and CIMT was conducted by constructing relevant models with SAS v6.12 (SAS Institute Inc., Cary, NC, USA). These were adjusted for age and sex, as well as comorbidities such as diabetes mellitus, hypertension, and dyslipidemia. Multiple comparisons with control type 1 error underwent correction with the Bonferroni method. Statistical significance was set at p<0.05.
Supplementary Materials
Abbreviations
IS: ischaemic stroke; ADAMTS7: A Disintegrin And Metalloproteinase with Thrombospondin 7; ECM: extracellular matrix; HCY: homocysteine; HDL: high-density lipoprotein; LDL: low-density lipoprotein; OR: odds ratio; CI: confidence interval; CIMT: carotid intima-media thickness.
Author Contributions
YL and GM conceived and designed the experiments. LC, WH and SL performed the experiments and wrote the paper. SY, MW, XC, SC, FD and PZ helped to collect all the samples and analyze statistical data. KL, WZ and BZ critically reviewed the manuscript. All authors read and approved the final manuscript.
Acknowledgments
We are grateful to the participants for participating in the study. We thank LetPub for providing linguistic assistance during the preparation of this manuscript.
Conflicts of Interest
The authors declare no actual or potential conflicts of interest.
Funding
This work was supported by the National Nature Science Foundation of China (grant numbers 81571157, 81300929 and 81670252).
References
- 1. Feigin VL, Norrving B, Mensah GA. Global Burden of Stroke. Circ Res. 2017; 120:439–48. https://doi.org/10.1161/CIRCRESAHA.116.308413 [PubMed]
- 2. Goldstein LB, Adams R, Becker K, Furberg CD, Gorelick PB, Hademenos G, Hill M, Howard G, Howard VJ, Jacobs B, Levine SR, Mosca L, Sacco RL, et al. Primary prevention of ischemic stroke: A statement for healthcare professionals from the Stroke Council of the American Heart Association. Stroke. 2001; 32:280–99. https://doi.org/10.1161/01.STR.32.1.280 [PubMed]
- 3. Wang L, Wang X, Kong W. ADAMTS-7, a novel proteolytic culprit in vascular remodeling. Sheng Li Xue Bao. 2010; 62:285–94. [PubMed]
- 4. Patel RS, Ye S. ADAMTS7: a promising new therapeutic target in coronary heart disease. Expert Opin Ther Targets. 2013; 17:863–67. https://doi.org/10.1517/14728222.2013.816287 [PubMed]
- 5. Liu CJ, Kong W, Ilalov K, Yu S, Xu K, Prazak L, Fajardo M, Sehgal B, Di Cesare PE. ADAMTS-7: a metalloproteinase that directly binds to and degrades cartilage oligomeric matrix protein. FASEB J. 2006; 20:988–90. https://doi.org/10.1096/fj.05-3877fje [PubMed]
- 6. Somerville RP, Longpré JM, Apel ED, Lewis RM, Wang LW, Sanes JR, Leduc R, Apte SS. ADAMTS7B, the full-length product of the ADAMTS7 gene, is a chondroitin sulfate proteoglycan containing a mucin domain. J Biol Chem. 2004; 279:35159–75. https://doi.org/10.1074/jbc.M402380200 [PubMed]
- 7. Wang L, Zheng J, Bai X, Liu B, Liu CJ, Xu Q, Zhu Y, Wang N, Kong W, Wang X. ADAMTS-7 mediates vascular smooth muscle cell migration and neointima formation in balloon-injured rat arteries. Circ Res. 2009; 104:688–98. https://doi.org/10.1161/CIRCRESAHA.108.188425 [PubMed]
- 8. Kessler T, Zhang L, Liu Z, Yin X, Huang Y, Wang Y, Fu Y, Mayr M, Ge Q, Xu Q, Zhu Y, Wang X, Schmidt K, et al. ADAMTS-7 inhibits re-endothelialization of injured arteries and promotes vascular remodeling through cleavage of thrombospondin-1. Circulation. 2015; 131:1191–201. https://doi.org/10.1161/CIRCULATIONAHA.114.014072 [PubMed]
- 9. Bauer RC, Tohyama J, Cui J, Cheng L, Yang J, Zhang X, Ou K, Paschos GK, Zheng XL, Parmacek MS, Rader DJ, Reilly MP. Knockout of Adamts7, a novel coronary artery disease locus in humans, reduces atherosclerosis in mice. Circulation. 2015; 131:1202–13. https://doi.org/10.1161/CIRCULATIONAHA.114.012669 [PubMed]
- 10. Bengtsson E, Hultman K, Dunér P, Asciutto G, Almgren P, Orho-Melander M, Melander O, Nilsson J, Hultgårdh-Nilsson A, Gonçalves I. ADAMTS-7 is associated with a high-risk plaque phenotype in human atherosclerosis. Sci Rep. 2017; 7:3753. https://doi.org/10.1038/s41598-017-03573-4 [PubMed]
- 11. Coronary Artery Disease (C4D) Genetics Consortium. A genome-wide association study in Europeans and South Asians identifies five new loci for coronary artery disease. Nat Genet. 2011; 43:339–44. https://doi.org/10.1038/ng.782 [PubMed]
- 12. Reilly MP, Li M, He J, Ferguson JF, Stylianou IM, Mehta NN, Burnett MS, Devaney JM, Knouff CW, Thompson JR, Horne BD, Stewart AF, Assimes TL, et al, and Myocardial Infarction Genetics Consortium; Wellcome Trust Case Control Consortium. Identification of ADAMTS7 as a novel locus for coronary atherosclerosis and association of ABO with myocardial infarction in the presence of coronary atherosclerosis: two genome-wide association studies. Lancet. 2011; 377:383–92. https://doi.org/10.1016/S0140-6736(10)61996-4 [PubMed]
- 13. Schunkert H, König IR, Kathiresan S, Reilly MP, Assimes TL, Holm H, Preuss M, Stewart AF, Barbalic M, Gieger C, Absher D, Aherrahrou Z, Allayee H, et al, and Cardiogenics, and CARDIoGRAM Consortium. Large-scale association analysis identifies 13 new susceptibility loci for coronary artery disease. Nat Genet. 2011; 43:333–38. https://doi.org/10.1038/ng.784 [PubMed]
- 14. CARDIoGRAMplusC4D Consortium, Deloukas P, Kanoni S, Willenborg C, Farrall M, Assimes TL, Thompson JR, Ingelsson E, Saleheen D, Erdmann J, Goldstein BA, Stirrups K, König IR, Cazier JB, et al, and DIAGRAM Consortium; CARDIOGENICS Consortium; MuTHER Consortium; Wellcome Trust Case Control Consortium. Large-scale association analysis identifies new risk loci for coronary artery disease. Nat Genet. 2013; 45:25–33. https://doi.org/10.1038/ng.2480 [PubMed]
- 15. Pu X, Xiao Q, Kiechl S, Chan K, Ng FL, Gor S, Poston RN, Fang C, Patel A, Senver EC, Shaw-Hawkins S, Willeit J, Liu C, et al. ADAMTS7 cleavage and vascular smooth muscle cell migration is affected by a coronary-artery-disease-associated variant. Am J Hum Genet. 2013; 92:366–74. https://doi.org/10.1016/j.ajhg.2013.01.012 [PubMed]
- 16. Pereira A, Palma Dos Reis R, Rodrigues R, Sousa AC, Gomes S, Borges S, Ornelas I, Freitas AI, Guerra G, Henriques E, Rodrigues M, Freitas S, Freitas C, et al. Association of ADAMTS7 gene polymorphism with cardiovascular survival in coronary artery disease. Physiol Genomics. 2016; 48:810–15. https://doi.org/10.1152/physiolgenomics.00059.2016 [PubMed]
- 17. Chan K, Pu X, Sandesara P, Poston RN, Simpson IA, Quyyumi AA, Ye S, Patel RS. Genetic Variation at the ADAMTS7 Locus is Associated With Reduced Severity of Coronary Artery Disease. J Am Heart Assoc. 2017; 6:e006928. https://doi.org/10.1161/JAHA.117.006928 [PubMed]
- 18. Du Y, Gao C, Liu Z, Wang L, Liu B, He F, Zhang T, Wang Y, Wang X, Xu M, Luo GZ, Zhu Y, Xu Q, et al. Upregulation of a disintegrin and metalloproteinase with thrombospondin motifs-7 by miR-29 repression mediates vascular smooth muscle calcification. Arterioscler Thromb Vasc Biol. 2012; 32:2580–88. https://doi.org/10.1161/ATVBAHA.112.300206 [PubMed]
- 19. You L, Tan L, Liu L, Shen R, Chaugai S, Wang DW, Cui W. ADAMTS7 locus confers high cross-race risk for development of coronary atheromatous plaque. Mol Genet Genomics. 2016; 291:121–28. https://doi.org/10.1007/s00438-015-1092-9 [PubMed]
- 20. Vargas JD, Manichaikul A, Wang XQ, Rich SS, Rotter JI, Post WS, Polak JF, Budoff MJ, Bluemke DA. Common genetic variants and subclinical atherosclerosis: The Multi-Ethnic Study of Atherosclerosis (MESA). Atherosclerosis. 2016; 245:230–36. https://doi.org/10.1016/j.atherosclerosis.2015.11.034 [PubMed]
- 21. Dechamethakun S, Ikeda S, Arai T, Sato N, Sawabe M, Muramatsu M. Associations between the CDKN2A/B, ADTRP and PDGFD polymorphisms and the development of coronary atherosclerosis in Japanese patients. J Atheroscler Thromb. 2014; 21:680–90. https://doi.org/10.5551/jat.22640 [PubMed]
- 22. Bayoglu B, Arslan C, Tel C, Ulutin T, Dirican A, Deser SB, Cengiz M. Genetic variants rs1994016 and rs3825807 in ADAMTS7 affect its mRNA expression in atherosclerotic occlusive peripheral arterial disease. J Clin Lab Anal. 2018; 32:e22174. https://doi.org/10.1002/jcla.22174 [PubMed]
- 23. Saleheen D, Zhao W, Young R, Nelson CP, Ho W, Ferguson JF, Rasheed A, Ou K, Nurnberg ST, Bauer RC, Goel A, Do R, Stewart AF, et al. Loss of Cardioprotective Effects at the ADAMTS7 Locus as a Result of Gene-Smoking Interactions. Circulation. 2017; 135:2336–53. https://doi.org/10.1161/CIRCULATIONAHA.116.022069 [PubMed]
- 24. Adams HP
Jr , Bendixen BH, Kappelle LJ, Biller J, Love BB, Gordon DL, Marsh EE3rd . Classification of subtype of acute ischemic stroke. Definitions for use in a multicenter clinical trial. TOAST. Trial of Org 10172 in Acute Stroke Treatment. Stroke. 1993; 24:35–41. https://doi.org/10.1161/01.STR.24.1.35 [PubMed] - 25. Lu X, Wang L, Chen S, He L, Yang X, Shi Y, Cheng J, Zhang L, Gu CC, Huang J, Wu T, Ma Y, Li J, et al, and Coronary ARtery DIsease Genome-Wide Replication And Meta-Analysis (CARDIoGRAM) Consortium. Genome-wide association study in Han Chinese identifies four new susceptibility loci for coronary artery disease. Nat Genet. 2012; 44:890–94. https://doi.org/10.1038/ng.2337 [PubMed]
- 26. Li Y, Liao F, Yin XJ, Cui LL, Ma GD, Nong XX, Zhou HH, Chen YF, Zhao B, Li KS. An association study on ADAM10 promoter polymorphisms and atherosclerotic cerebral infarction in a Chinese population. CNS Neurosci Ther. 2013; 19:785–94. https://doi.org/10.1111/cns.12136 [PubMed]
- 27. Livak KJ, Schmittgen TD. Analysis of relative gene expression data using real-time quantitative PCR and the 2(-Delta Delta C(T)) Method. Methods. 2001; 25:402–08. https://doi.org/10.1006/meth.2001.1262 [PubMed]